MISSED APPOINTMENTS
OVERVIEW
Visualize key performance indicators (KPIs) that yield meaningful trends to meet business objectives by monitoring missed appointments and last-minute reschedules for the past 12 months. Track missed exam counts and no-show rates within the context of active exam volume across potential influencers, including facility, department, time of day, day of week, and referring provider. Through interactive visuals, review patient factors such as patient type, age and location (county/zip code of residence).
Requirements:
- MedInformatix v7.7
Explanations:
- Same-Day Reschedule Rate – Flagged exams (R, P) within 1 day or less of the appointment date divided by total exams (rescheduled plus active exams), within the selected time period, up to 12 months based on the appointment date. Expressed as a percentage.
- No-Show Rate – Missed exam count divided by total exams (missed plus active exams) within the selected time period, up to 12 months based on the appointment date. Expressed as a percentage.
- Missed and Rescheduled – Appointments flagged as missed with an appointment in the same department scheduled within 30 days.
- Missed and Lost – Appointments flagged as missed with no appointment in the same department scheduled within 30 days.
- Flagging – Appointments flagged as Missed (M) are captured in this report. If the appointment is re-flagged, then it can no longer be reported as a no-show here. In the core app, the appointment history documents all flagging activity of any given appointment.
- Flagging Notes – When users flag appointments they have the option (or may be required) to provide additional information. Flagging explanations may be useful for reporting trends when structured data is available. When free-text flagging notes are collected instead, reporting trends may be harder to analyze. In this report, flagging notes are available in the Decomposition Tree and Q&A pages.
Data source: [dbo].[pbi_activity_log]= view of [dbo].[CLDEMOG], [dbo].[CLMASTER], [dbo].[CLZIPS], [dbo].[CLPATATTRIB], [dbo].[MWBOOK], [dbo].[MWREASON], [dbo].[CLUSER], [dbo].[CLREFER], [dbo].[MWAPPTS] tables and [dbo].[pbi_facilities] = view of [dbo].[CLFAC]. Test patient accounts excluded.
Standard Page Slicers (Filters): Sync across pages unless indicated otherwise.
- MI-BI Logo – Click to reset report to default settings. Now includes report version.
- Date Range – Actual date range corresponding to the current view.
- Exam Date Picker – Defaults to 12-month exam date range for report. Use the slider or date picker to select new start or end dates.
- Service Day – Day of the week corresponding to the appointment date. By default, Monday through Friday are selected.
- Facility – Service facility associated with the appointment.
- Department – Department associated with the appointment.
- Patient Type – Patient Type selected from Patient Demographics corresponding to the appointment.
- Page Instructions – Brief explanations or tips about the current page. Includes a More link to this documentation (resources.medinformatix.com).
Pages:
Overview
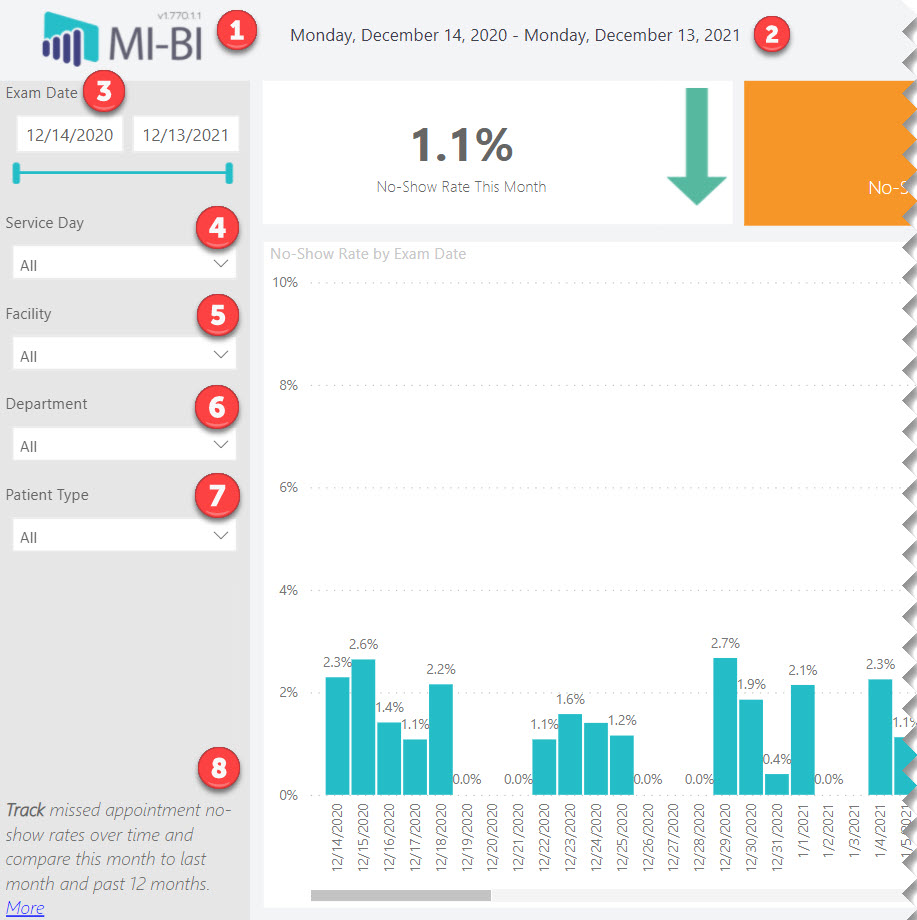
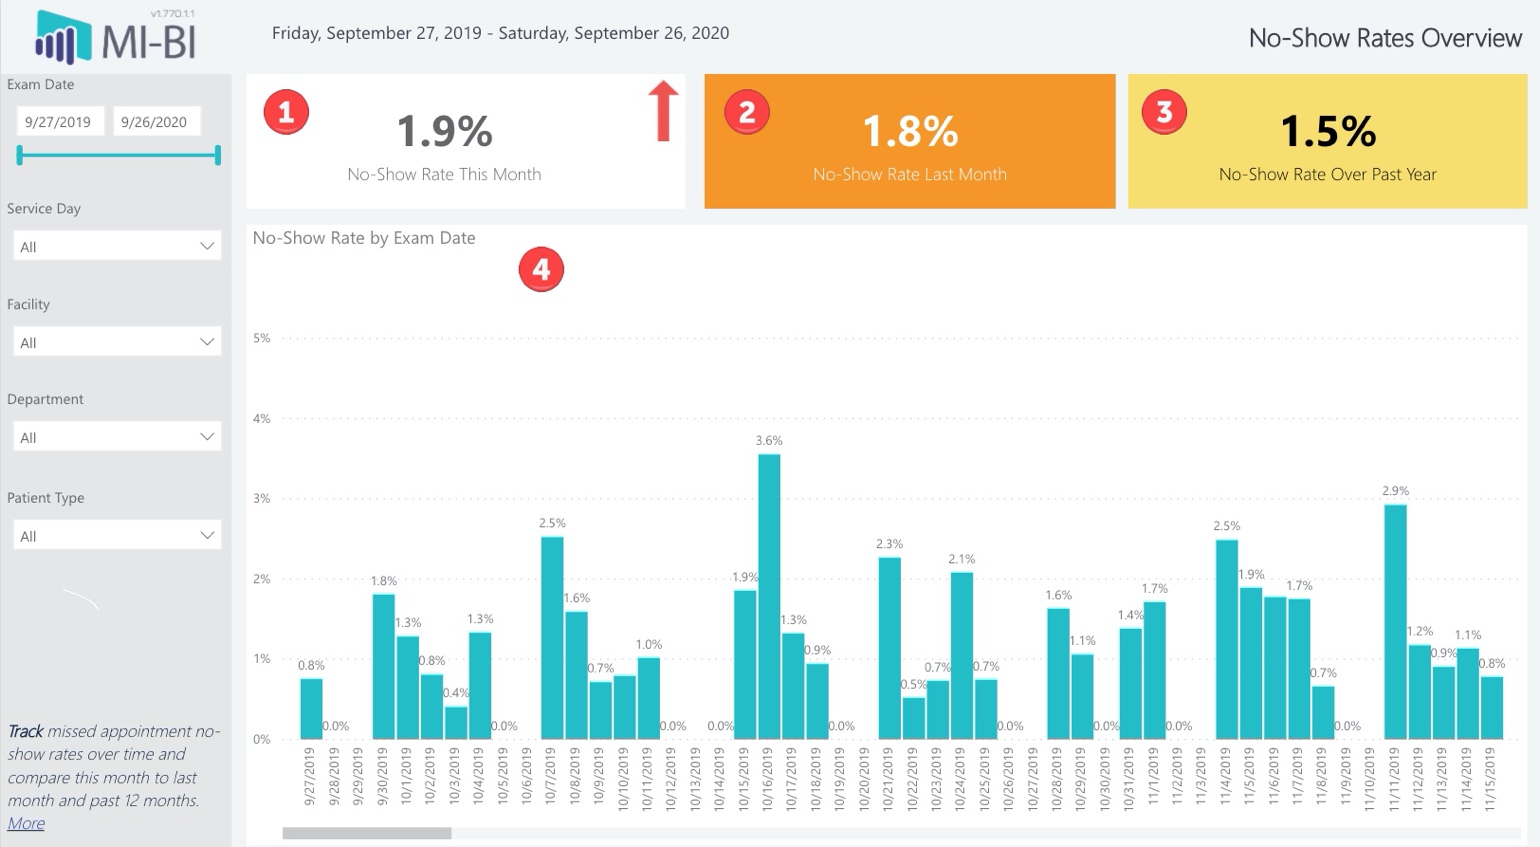
- No-Show Rate This Month – Displays the no-show rate for the current month, no matter the exam date range selected. A downward green arrow indicates a decrease from last month. A red up arrow indicates an increase from the prior month.
- No-Show Rate Last Month – Displays the no-show rate for the prior calendar month.
- No-Show Rate Over Past Year – Displays the no-show rate for the last 12 months, which corresponds to the entire time period included in this report.
- No-Show Rate by Exam Date – Linear column chart displays the no-show rate by appointment date. Toi view any specific date, right-click a column and Drill through to Details.
Days of Week, Time of Day
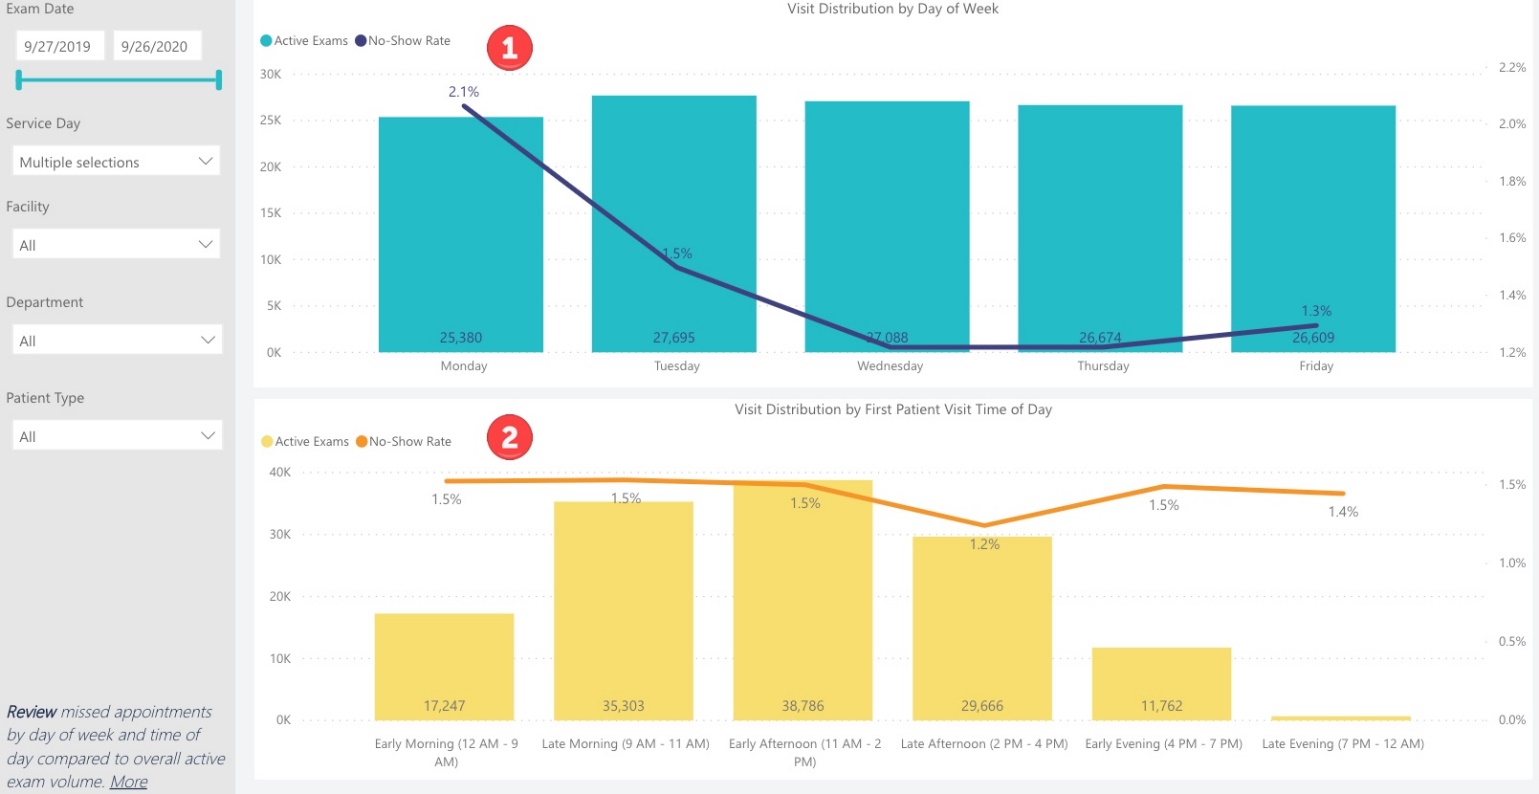
- Visit Distribution by Day of Week – Active exam count with line graph indicating no-show rate by day of the week. Hover for tooltip displaying active exam count, missed exam count and no-show rate for the given day.
- Visit Distribution by Time of Day – Active exam count with line graph indicating no-show rate by time of day, grouped for easy comparison (e.g. Early Morning, Late Morning, Early Afternoon, etc.). Hover for tooltip displaying active exam count, missed exam count and no-show rate for the selected time period.
Scheduling Trends
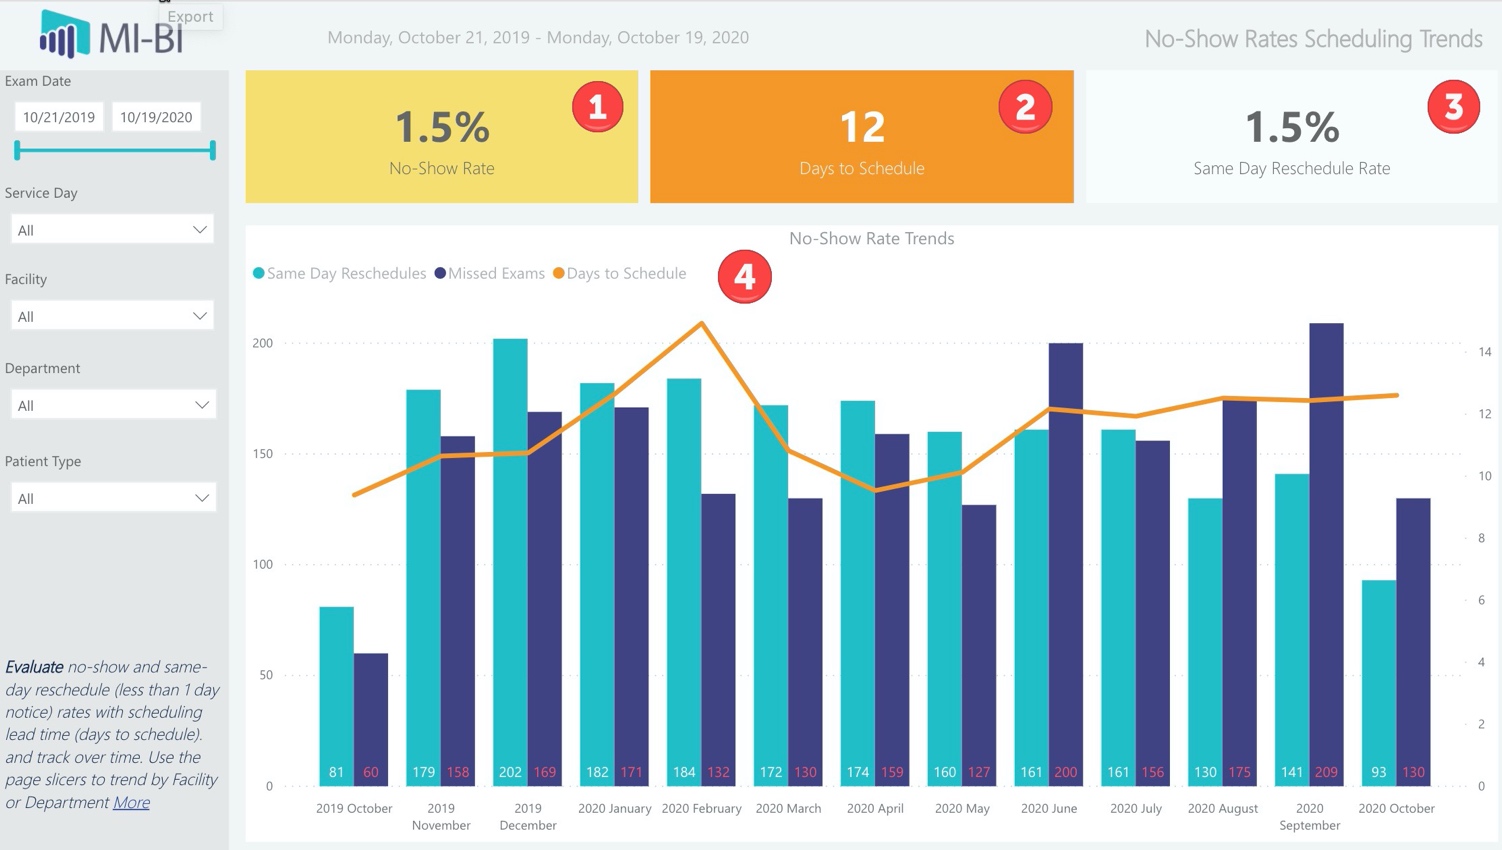
- No-Show Rate – No-Show rate for the selected date range.
- Days to Schedule – Number of days between when the appointment is created to the actual appointment date, averaged over the past 12 months.
- Same Day Reschedule Rate – Same day reschedules (within 1 day or less) for the selected date range.
- No-Show Rate Trends – Clustered column chart displays the same-day reschedule counts and missed exam counts for each month in the past 12 months. The line graph overlays the days to schedule for the corresponding calendar month. Drill up for annual totals, drill down for calendar months or calendar dates. From the top, expand (fork) to return to the default linear timeline. Hover for tooltip displaying active exam count and no-show rate for the selected date period.
Facility, Department and Exam Trends
- No-Show Rates by Facility – Column chart defaults to facilities sorted by active exam count. Line graph displays the corresponding no-show rate.
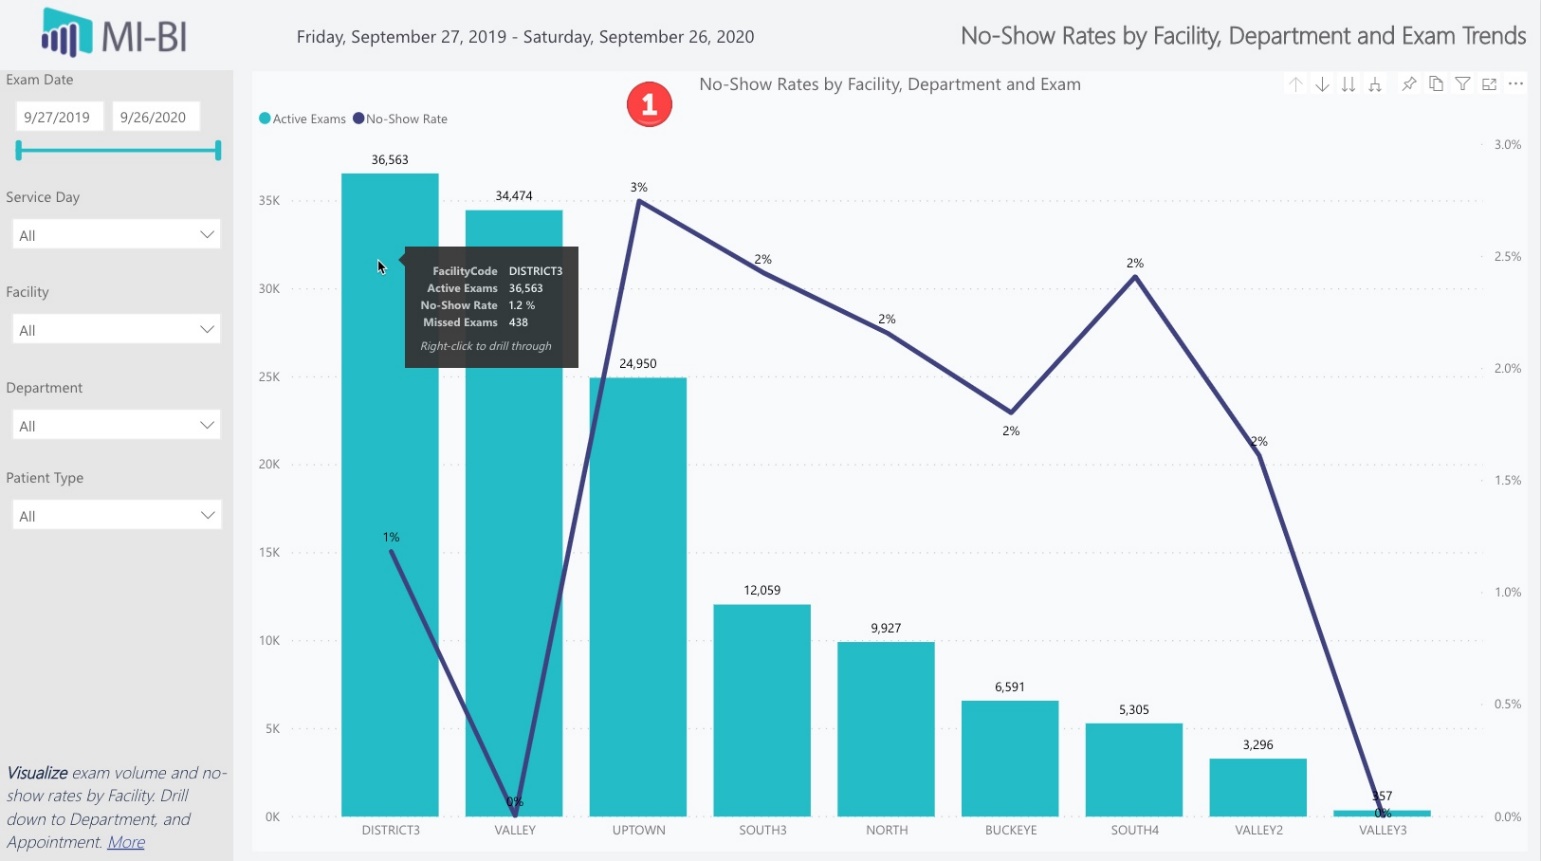
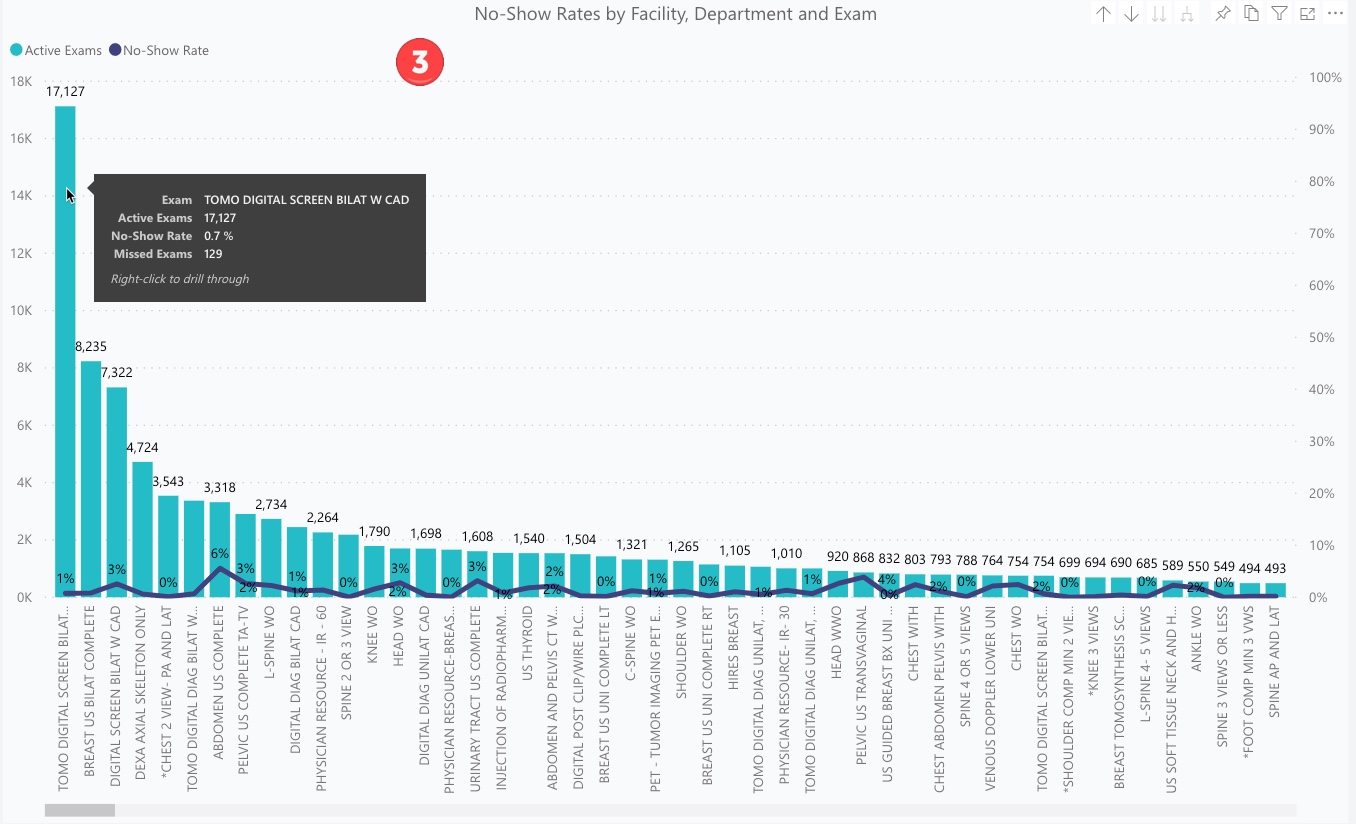
- No-Show Rates by Department - Drill down to view volume and no-shows by department.
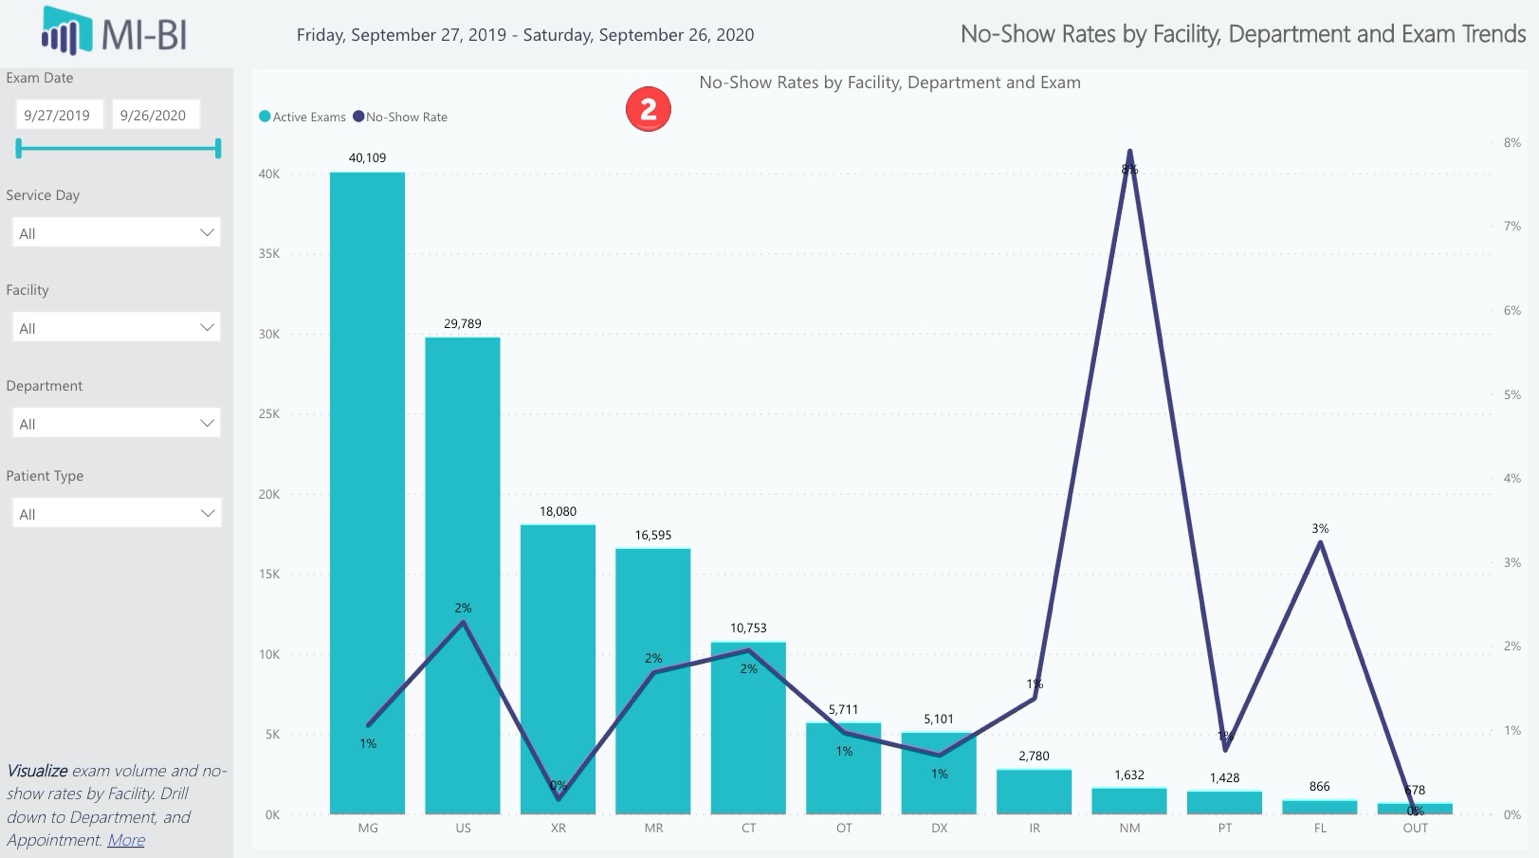
- No-Show Rates by Exam - Drill down again to display exams. Expand (fork) to view departments by facility, or exams by department. Hover for tooltip displaying active exam count, missed exam count and no-show rate for the selected column.
Referring Physician
- Summary – Grid lists referral organization/provider, missed exams, active exams, no-show rate, rescheduled and lost counts. Sort by any column by clicking the column header. Default sort is by top missed appointments. Drill down from Organization (Referral Group) to Referring Physician (Referral Source). To view appointment details, right-click any row and Drill through to Details.
- Includes a visual indicator for missed and active exams helps identify the highest counts.
-
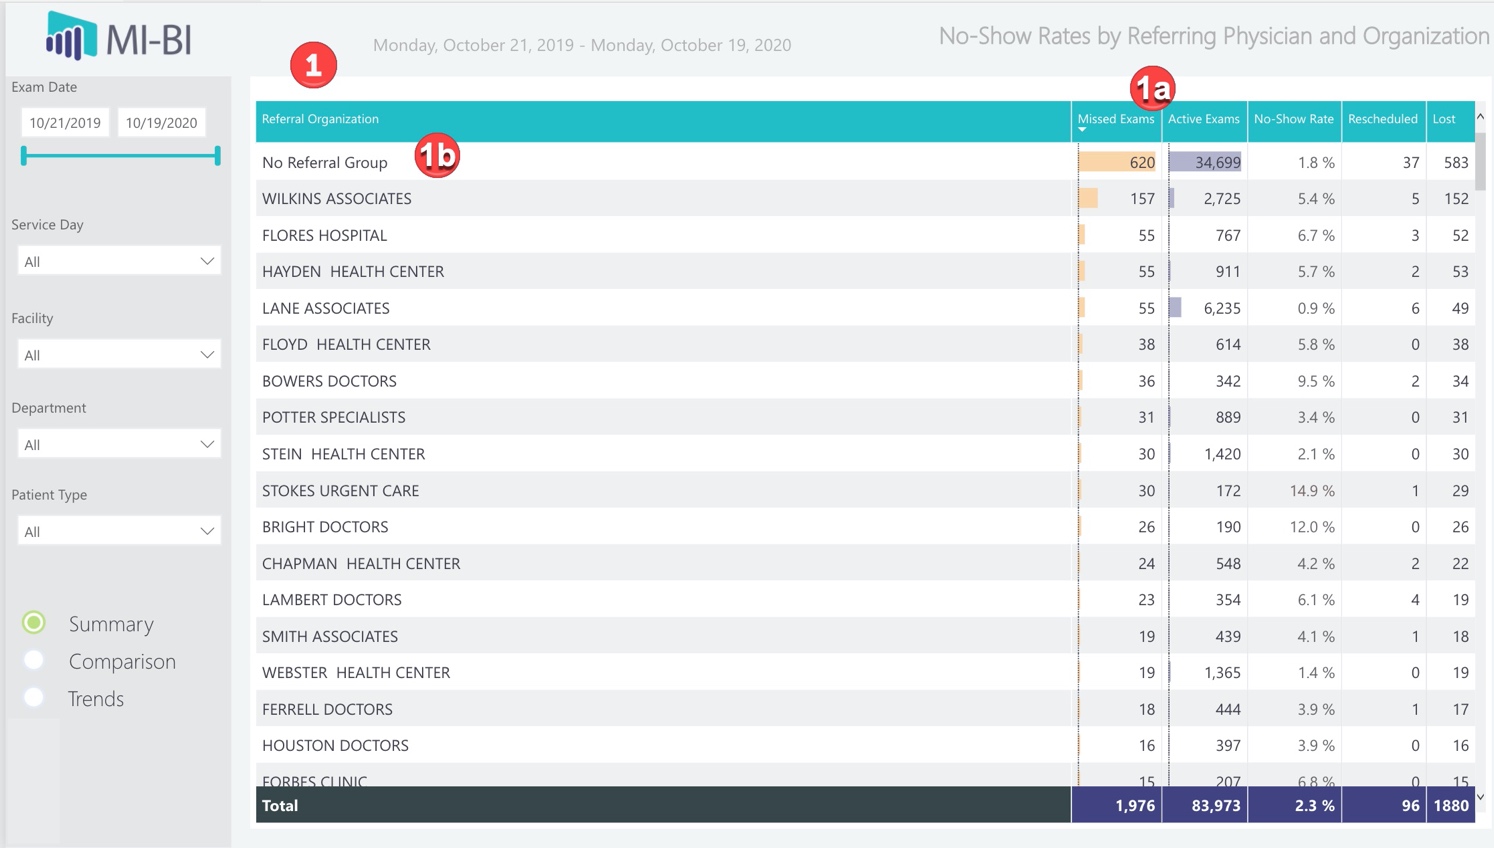
Referral sources not associated with a referral group are categorized together and labeled as “No Referral Group” in the grid
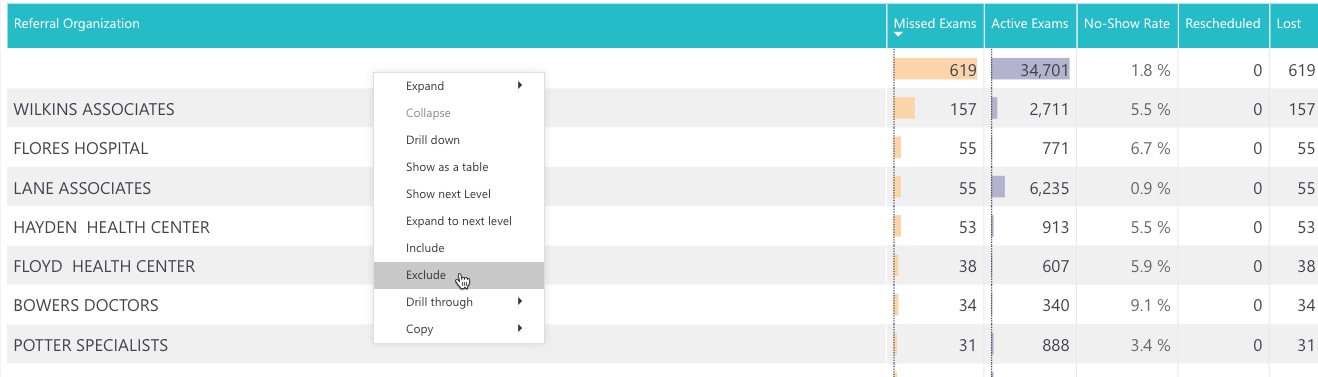 Tip: To exclude an outlier for the current session, right-click on the row and click Exclude.
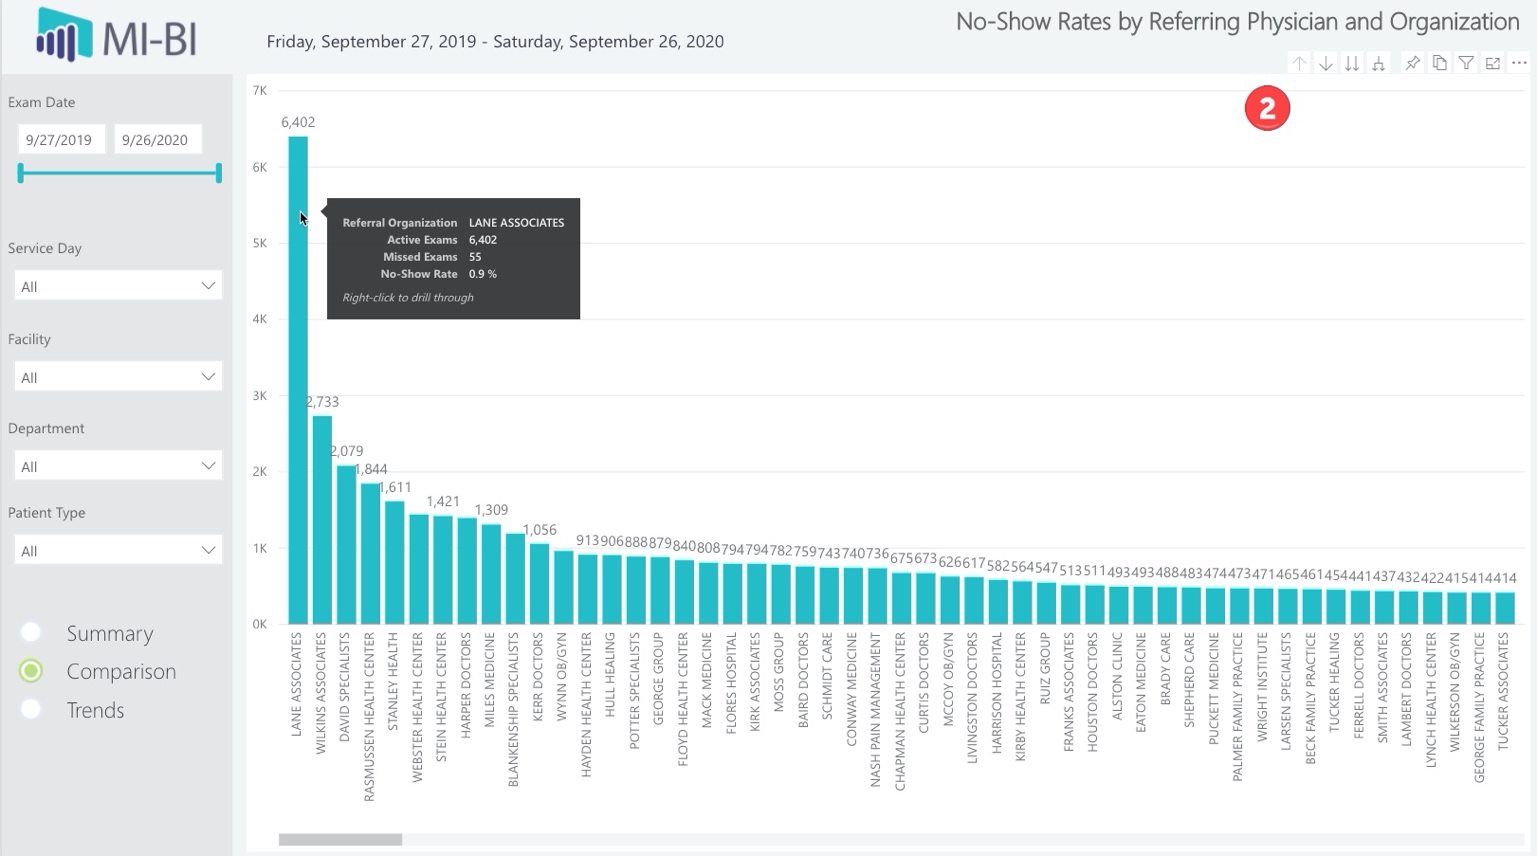
- Comparison – Column chart displays referring organizations by active exam volume. Drill down to display referring provider. Hover for tooltip displaying active exam count, missed exam count and no-show rate for the selected provider/group.
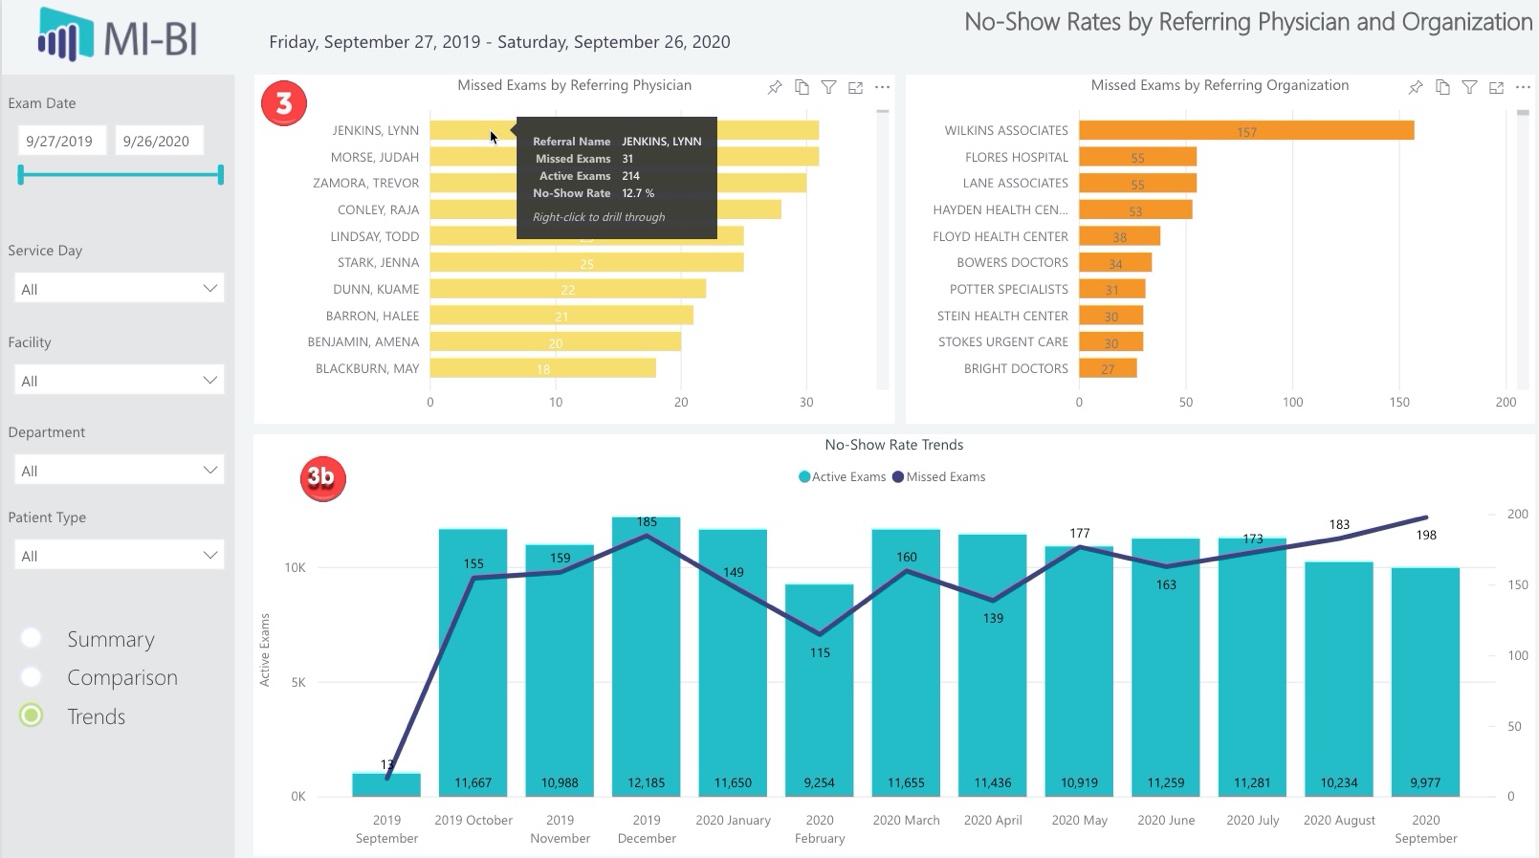
- Trends – Funnel charts display missed exam counts by top referring providers and organization, respectively.
- Cross-filter - Select any provider or group to cross-filter with the other visuals, including the active and missed exam volume over time. Hover for tooltip displaying active exam count, missed exam count and no-show rate for the selected item.
- No-Show Rate Trends – Displays active exam volume by month over the past year with a line graph displaying the missed exam count for the corresponding month. Expand (fork) to display by exam date. Drill up to annual counts and drill down to calendar month or date.

Decomposition
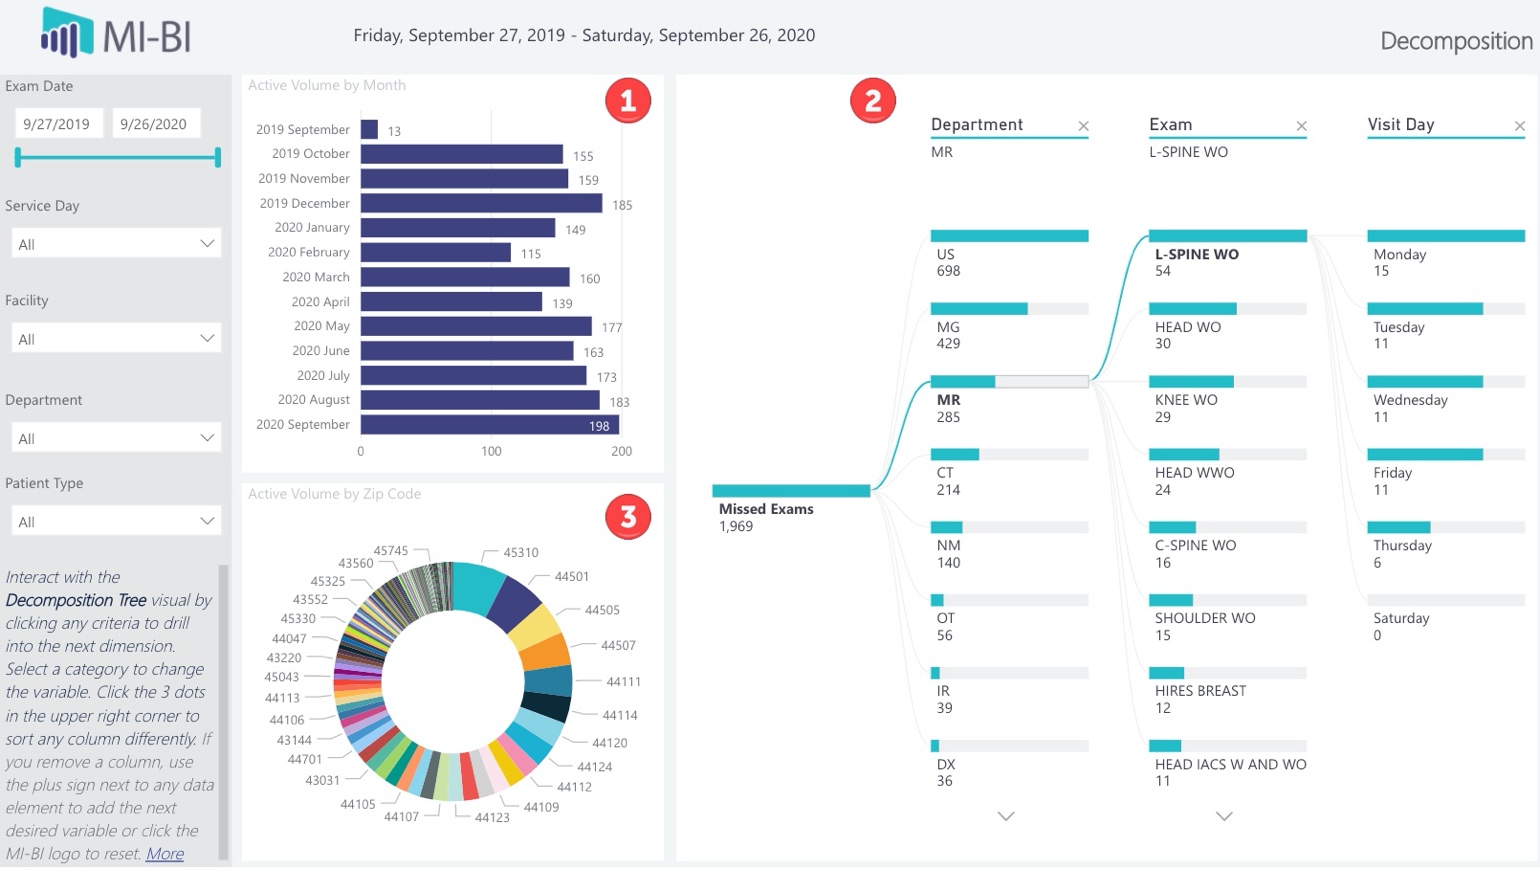
- Active Volume by Month – Stacked bar chart displays active exam volume by month. Click any month to cross-filter with the other visuals. Hover for tooltip displaying active exam count, missed exam count and no-show rate for the selected month.
- Active Volume by Zip Code – Donut chart displays active exam volume by patient zip code. Hover for tooltip displaying active exam count, missed exam count and no-show rate for the selected zip code.
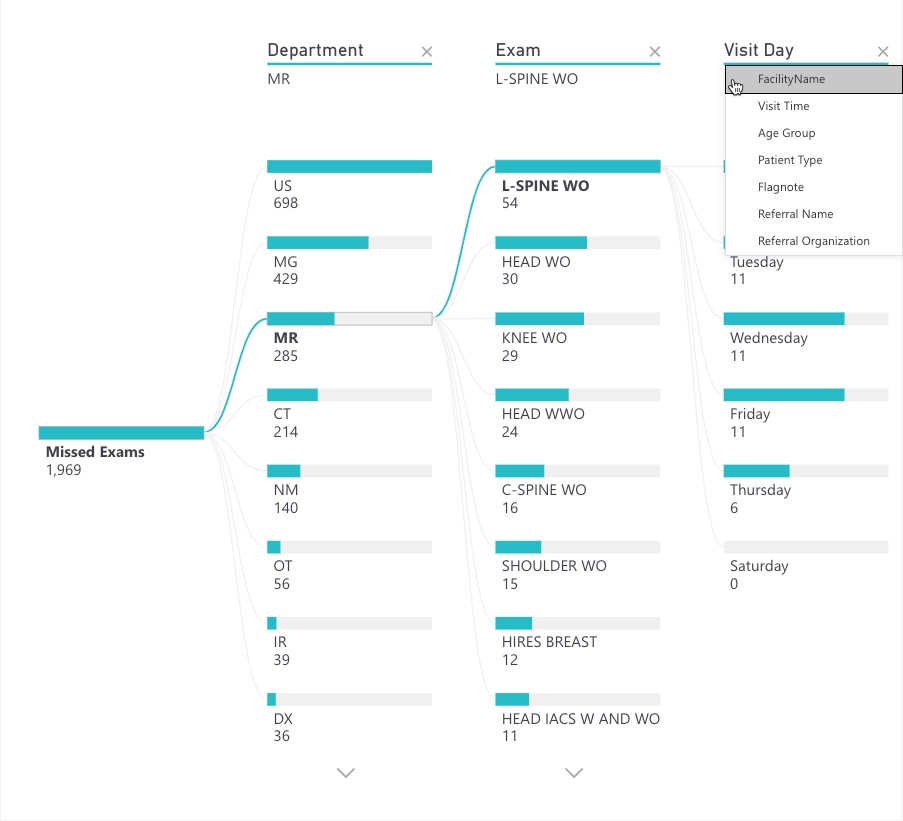
- Decomposition Tree – Analyze data in the hierarchy for quick analysis. Break down data from total missed exam count into categories and determine the high to low values (indicated by shaded bar and count label). Click bars to break down by the next category. Right-click any bar to Drill through to Details.
- Available criteria/variables: Facility, Department, Exam, Visit Day, Age Group, Patient Type, Referral Name, Referral Organization, Flagnote.
- Select a category to change the variable. Up to three may be displayed at a time, and only once. Use the “x” to remove a category and use the “+” sign to select new criteria.
- Use the 3 dots in the upper right corner to change the sorting of the values under each criteria category.
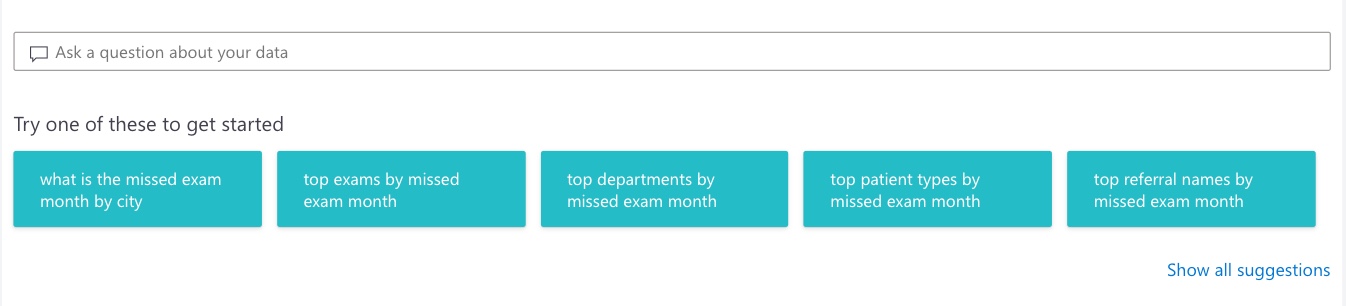
Q&A – Power BI AI tool to explore your data using natural language capabilities to receive the answers in the form of charts and graphs. Q&A only provides results about data in Power BI. The suggestions may not apply so try these to get started:
- Missed exam count by preferred language
- Missed exam count by communication preference
- Missed exam count by age group
- Missed exam count by ptype
- Lost by department
- Active exam by referral and missed exams by referral
- Active exam by referral organization and missed exams by referral organization
- Count userflags (X,C,L,R,P) by ptype exam month
County
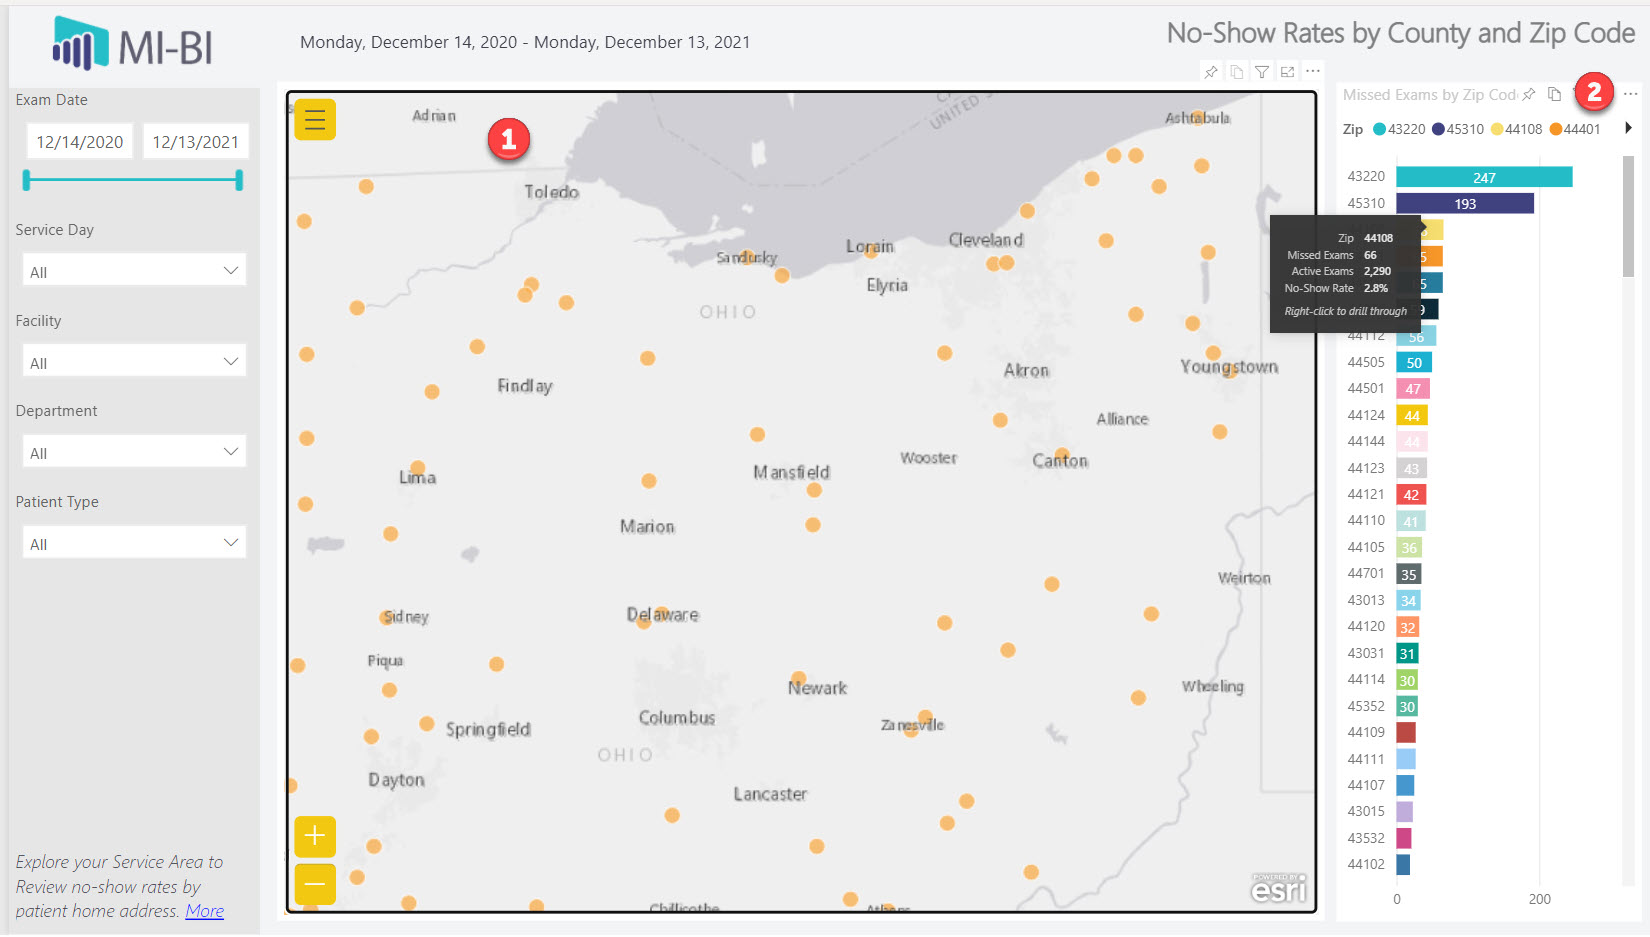
- No-Show Rates by County – Displays no-show rates attributed to patient’s home address. Hover for tooltip displaying the no-show rate, missed exam count and selected zip code. Select any dot to cross-filter with the zip code chart, with the option to right-click and drill through to the appointment details.
- Missed Exams by Zip Code – Missed exam count by patient home zip code, sorted high to low. Hover for tooltip displaying active exam count, missed exam count and no-show rate for the selected zip code. Click any zip code to zoom into the map area. To view appointment details, right-click to drill through to the Details page.
Details – Grid of appointment details. Sort by any column by clicking the column header. Use the arrow to return to the previous page.
- Account – Patient account/mrno
- Patient Name – Patient first and last name
- Facility Name – Service facility where appointment is/was scheduled
- Department – Department associated with the appointment
- Exam – Appointment reason description
- Exam Date – Appointment date
- Same Day Reschedule – Appointment was flagged (R, P) within 1 day of appointment date
- Missed – Appointment was flagged as Missed
- Rescheduled – Appointment was flagged as Missed and then an appointment in the same department was scheduled within 30 days of the flag event
- Lost – Appointment was flagged as Missed and no appointment in the same department was scheduled within 30 days of the flag event
- Referral Name – Referral source display name
- Referral Organization – Referral group name
- Communication Preference – Selected in patient demographics
- Age Group – Patient’s age at the time of the appointment is grouped into an age range
- Sex – Patient sex as defined in demographics
- Patient Type – Patient Type selected in patient demographics
- Preferred Language – Primary language when defined in demographics
- State – State documented as patient’s home address
- Flagnote – Explanation selected or typed when the appointment was flagged
- Userflag – Category selected when the appointment was flagged as Missed, Rescheduled, Cancelled, etc.