
MI-BI: Revenue Cycle Dashboard
OVERVIEW
Visualize key financial performance indicators (KPIs) that yield meaningful trends to meet business objectives of Revenue Cycle Management (RCM).
- KPIs are fixed, reliable and comparable over time to yield meaningful trends with benchmarks (goals).
- Forecast results to show correlation and track performance over time.
- Monitor performance with a KPI dashboard optimized for mobile devices.
Requirements:
- MedInformatix version 7.7
- HDL Module (RCM-HDL Report)
- Billing without HDL Module (RCM Report)
Definitions:
- Working Days - days on which a charge was entered
- KPI Text color - corresponds to whether the value is above (green) or below (orange) the selected goal value
- Exclamation (!) - appears when threshold is exceeded
- Checkmark - appears if average is below threshold
- Green down arrow - appears when the current metric has decreased since this month last year
- Red up arrow - appears when the current metric is higher than this month last year
- Slicer* - synced on one or more pages throughout the report
Pages (Tabs):
Days to Bill Trends
How quickly are claims submitted? Track the current month and compare to last month, last year and year-to-date averages. Days to bill counts the number of working days between the service date and bill date. Color and symbol indicators when metrics fall above or below goal thresholds or are trending up or down from last month. Drill into details to review outliers.
Data Source: [dbo].[pbi_rcm_billing_lag] = view of CLCHARGE, CLCLAIM, CLNAME, CLINS, CLFSCHED, hdl_charges_log, hdl_charges, hdl_masterclaim, clhl7dftimport
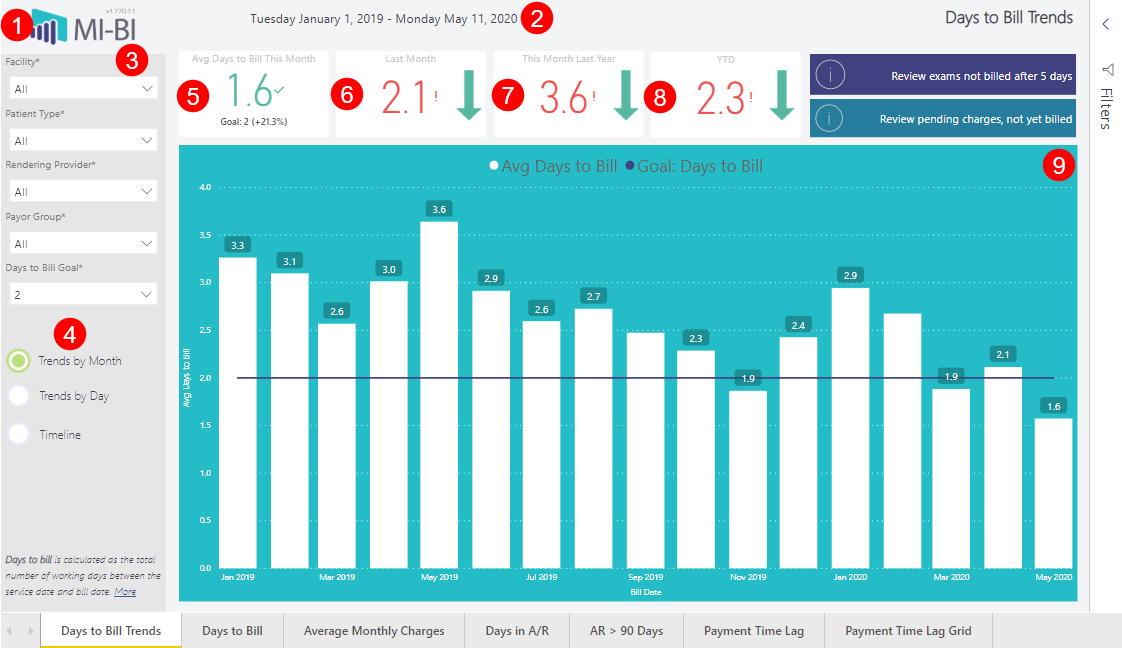
- MI-BI Logo – click to reset slicers to default values.
- Current Date Range – Displays the actual date range presented in the current view.
- Slicers:
- Facility* - Service Facility by default, also available as a report-level filter. Synced throughout report.
- Patient Type* - From the charge, not patient-level or from the primary insurance. Synced with Days to Bill Trends and Days to Bill pages.
- Rendering Provider *- Associated to clcharge.rdoc and the service facility. Synced throughout report wherever the slicer is visible.
- Payor Group* - Primary insurance insclass.
- Days to Bill Goal* - Hard-coded in the report as 1-10, 14, and 28 (default is 2). Affects the color of the KPI card text and the constant line on the “Trends By Month” column chart. Synced with Days to Bill Trends and Days to Bill pages
- Other page-level filters include: Fee Type and Type of Service (TOS) 1 – 4
- Radio Buttons – Click each to change the large visual, not the KPI card values. See explanations below.
- Avg Days to Bill This Month – Total number of working days between service date and bill date divided by total number of charges where bill date is in the current month, as of the last refresh. Text color depends
on whether the value is above (green) or below (orange) the selected Days to Bill Goal. An exclamation (!) will appear when threshold is exceeded; a checkmark when the average is below the threshold.
- Last Month - Total number of working days between service date and bill date divided by total number of charges, where the bill date is in the past month, as of the last refresh. Text color depends on whether the value is above (green) or below (orange) the selected Days to Bill Goal. An exclamation (!) will appear when threshold is exceeded; a checkmark when the average is below the threshold. A green down arrow indicates that the current metric has decreased since last month. A red up arrow indicates that the current metric is higher than last month.
- This Month Last Year - Total number of working days between service date and bill date divided by total number of charges, where the bill date is in this month last year, as of the last refresh. Text color corresponds to whether the value is above or below the selected Days to Bill goal. Green down arrow will appear if the current metric has decreased since this month last year. Red up arrow will appear if the current metric is higher than this month last year.
- YTD - Total number of working days between service date and bill date divided by total number of charges, where the bill date is in the current year (as of the last refresh). Text color depends on whether the value is above or below the selected Days to Bill goal. Green down arrow will appear if the current metric is lower than this year's average. Red up arrow will appear if the current metric is higher than the year's average.
- Trends by Month (radio button) Column Chart
- Avg Days to Bill counts the total number of working days between the service date and bill date divided by the total number of charges for each bill date month since January 1 of last year.
- Days to Bill is a constant line corresponding to the selected value in the Days to Bill Goal slicer (default is 2).
10. Trends by Day (radio button) Calendar Visuals
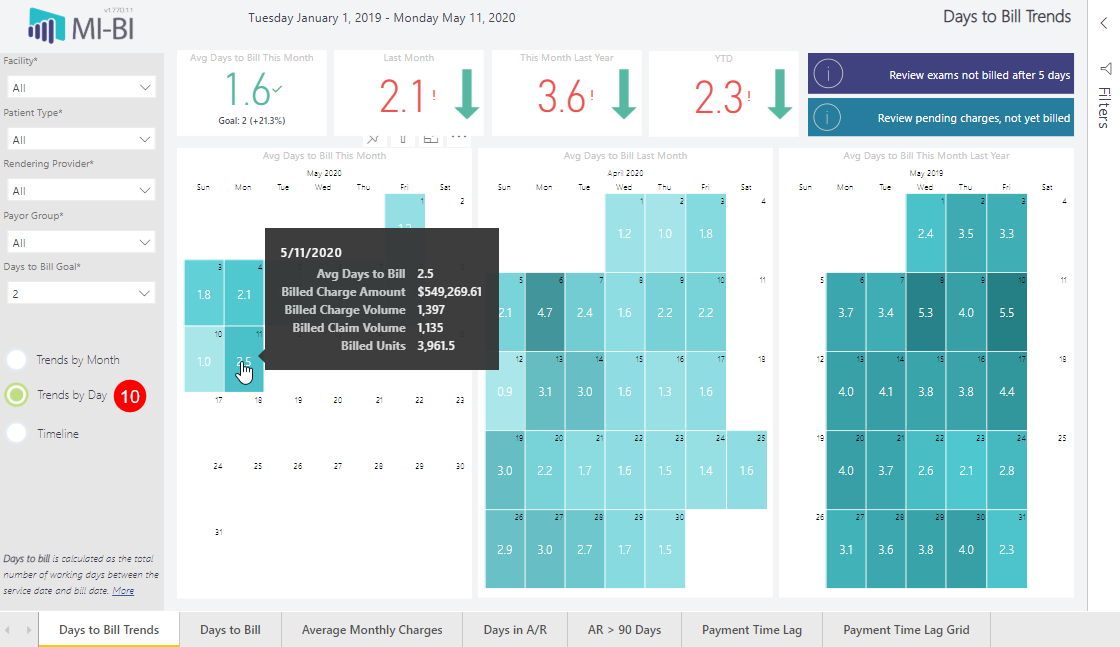
- Avg Days to Bill value in each day of the calendar, This Month, Last Month, and This Month Last Year. Total number of working days between service date and bill date divided by the total number of charges for each bill date.
- Billed Charge Amount (tooltip) - total charge amount corresponding to selected charge bill date.
- Billed Charge Volume (tooltip) - distinct count of Charge Id's corresponding to selected charge bill date.
- Billed Claim Volume (tooltip) - distinct count combination of account and incidents (primary key in CLCLAIM) corresponding to selected charge bill date.
- Billed Units (tooltip) - total charge units (CLCHARGE) corresponding to selected charge bill date
11. Timeline (radio button) (HDL version only)
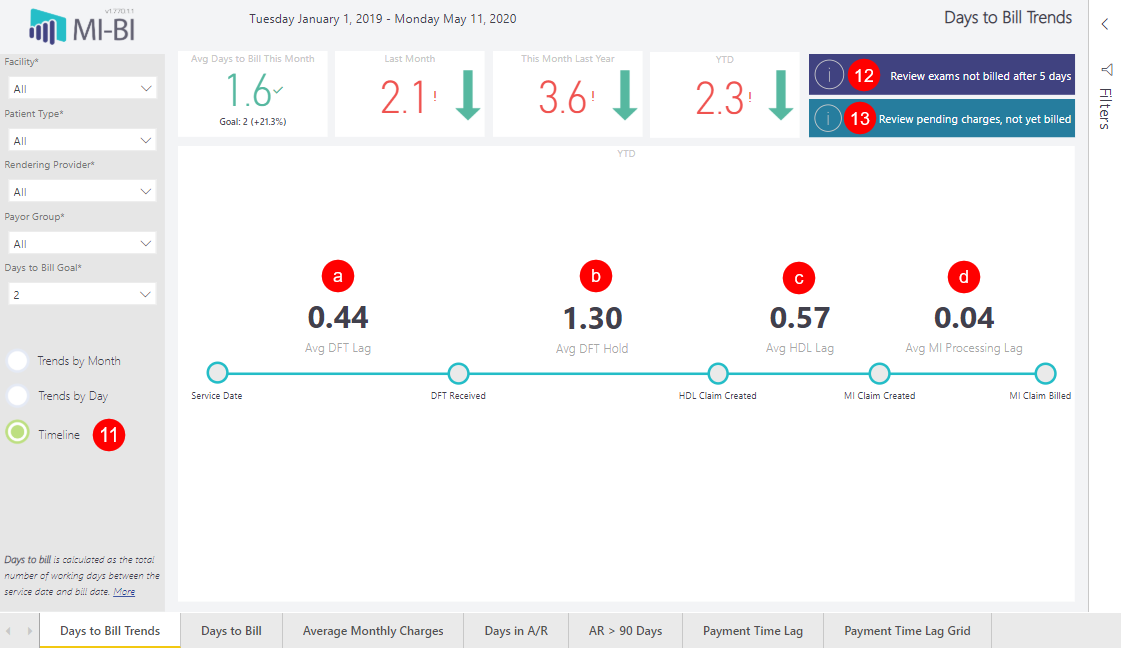
Note: All lag and hold times are calculated in days. All averages are calculated per charge, not per claim or DFT.
Avg DFT lag – average time from service date to receiving the charge from coding system.
- Total number of days between service date and date DFT was received divided by total number of charges received via HL7, where the final charge bill date is in the current year (YTD average).
- Average lag is calculated per charge (CLCHARGE), not per DFT since DFT can contain multiple charges.
- Based on the average number of days, not working days.
- Default installation references CLHL7DFTIMPORT.TSTAMP as the date the DFT was received. A substitute view should mirror the standard table structure of CLHL7DFTIMPORT.TSTAMP.
- DFTs that arrives prior to the service date are not considered.
- Lag and hold times are calculated in days.
Avg DFT Hold – average time to create HDL claim.
- Total number of days between date DFT was received and date corresponding HDL claim was created divided by total number of charges received via HL7, where the final charge bill date is in the current year (YTD average).
- Based on the average number of days, not working days.
- DFTs received prior to the service date are not considered (negative lag).
Avg HDL Lag – average time to work claims in the HDL.
- Total number of working days between date HDL claim was created and date HDL claim was transferred/total number of HDL charges, where the charge bill date is in the current year (YTD average).
- Working days are days on which a charge was entered.
- HDL claims created prior to DFT arrival are not considered (negative lag).
Avg Processing Lag – average time to process and bill charges.
- Total number of working days between charge entry date and charge bill date divided by total number of distinct charges, where charge bill date is in the current year (YTD average).
- Charges billed prior to CLCHARGE entry date are not considered (negative lag).
Exception Detail Report – Review exams not billed after 5 days (bookmark) - Unbilled Charges Page
Data source: [dbo].[pbi_rcm_unbilled_exams] = view of mwappts, clmaster, mwreason, mwbook, cluser, clcharge, clclaim, and clapptnorelate
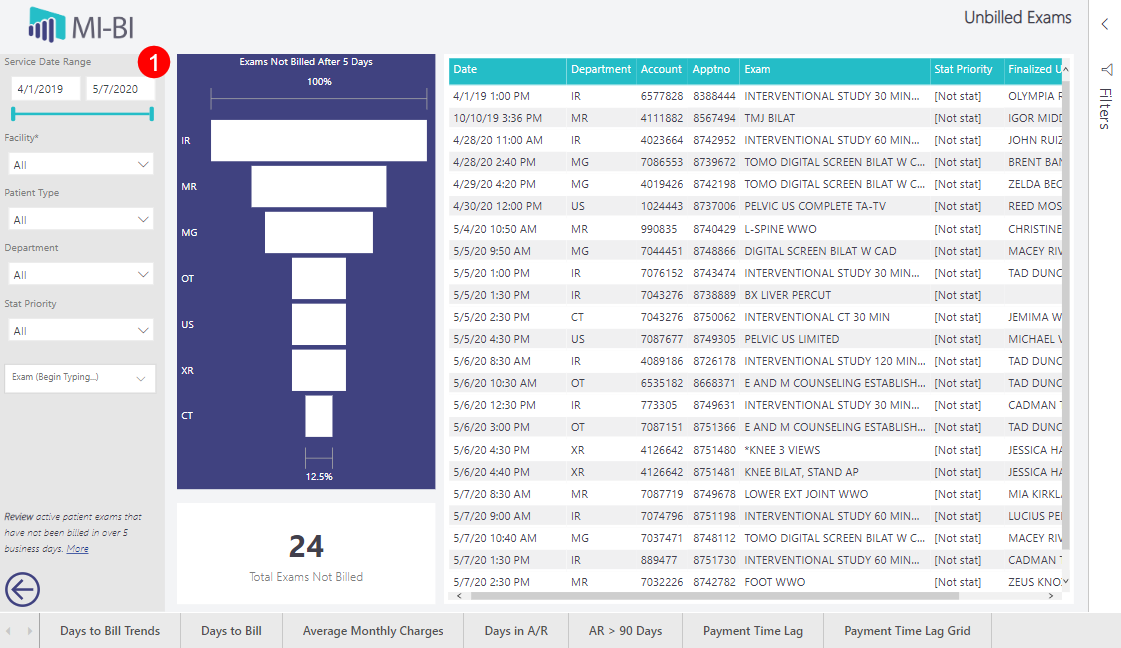
Slicers:
- Create/Entry Date Range - time stamp ORU was received or create date of HDL claim or charge entry date, depending on where the claim is being held at the time of report refresh.
- Service Date Range – date of service taken from DFT/ORU, the HDL claim, or the MedInformatix claim, depending on where the claim is being held at the time of report refresh.
- Hold Category – "MedInformatix","HDL", or "DFT", depending on where the claim is being held at the time of report refresh.
- Unbilled Charge Status -
- On Hold (clcharge.status = H)
- New (clcharge.status = X)
- Generated (clcharge.status = N)
- Posted (clcharge.status = Y)
- Unknown (clcharge.status none of the above and clcharge.billed=U)
- In HDL - charge status AAA (hdl_charges.recordstatus is not duplicate, deleted, or pending)
- In HDL - batch status BBB (hdl_importBatch.batchstatus is not duplicate, deleted, complete, or pending)
- In HDL - claim status CCC (hdl_masterclaim.masterClaimStatus is not complete, duplicate, or deleted)
- DFT Received - status DDD (clhl7dftimport.status is not imported, duplicate, or deleted)
- Patient Type - from the charge/HDL claim/patient account if DFT can be linked to a valid MedInformatix patient.
- Type of Service 2 - TOS2, as indicated in the fee schedule (typically the modality/department associated to the charge).
Note: Because this data set is a combination of exceptions from multiple data sources, none of the slicers on this page are synced to any other slicers in this report.
Note: By default, charges associated to inactive CPT codes, CPT codes with a no-bill flag, or CPT codes with the QDC flag will be excluded. This can be adjusted in the page-level filters.
13. Exception Detail Report – Review pending charges, not yet billed (bookmark) - Charges Not Billed - Donut Chart
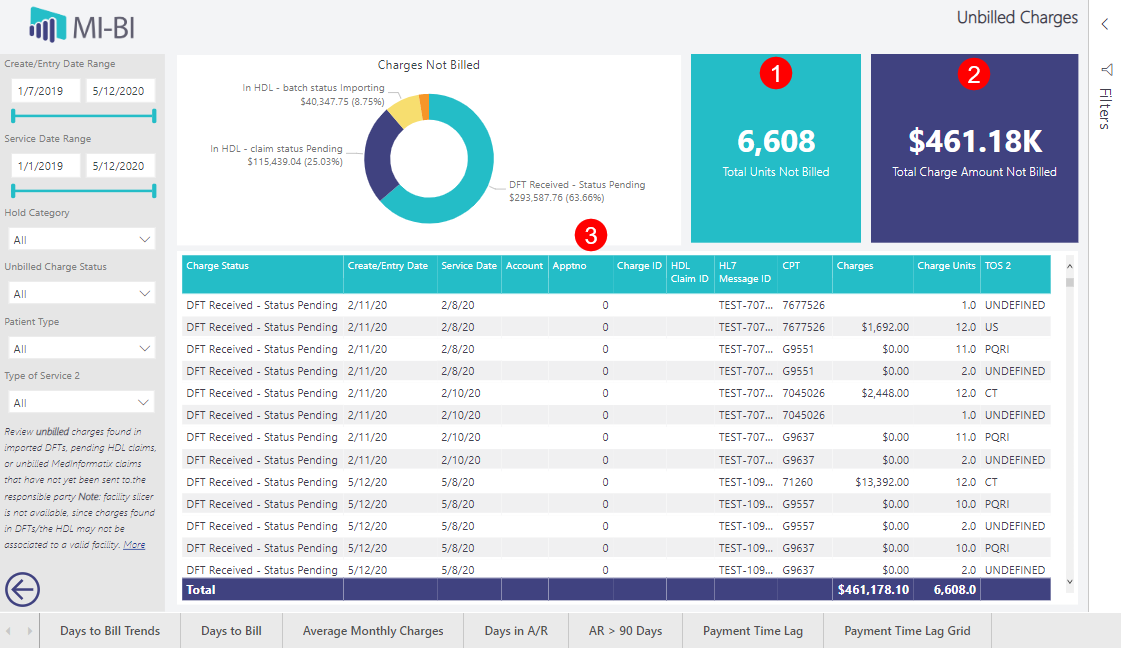
- Total unbilled charges dollar amount categorized by hold category.
- Click any category to update the grid with charge details.
- Total Units Not Billed KPI card - total unbilled charge units (in CLCHARGE, BILLED=U OR in hdl_masterclaim, masterClaimStatus is not complete, duplicate, or deleted (and charge and batch are not duplicate/deleted) OR in CLHL7DFTIMPORT, STATUS is not imported, duplicate, or deleted)
- Total Charge Amount Not Billed KPI card- total unbilled charges (in CLCHARGE, BILLED=U OR in hdl_masterclaim, masterClaimStatus is not complete, duplicate, or deleted (and charge and batch are not duplicate/deleted) OR in CLHL7DFTIMPORT, STATUS is not imported, duplicate, or deleted)
- Unbilled Charge Details Table - Sort by any column
- Charge Status – depends on hold category (see details in section above).
- Create/Entry Date - time stamp ORU was received or create date of HDL claim or charge entry date, depending on where the claim is being held at the time of report refresh.
- Service Date - date of service taken from DFT/ORU, the HDL claim, or the MedInfo claim, depending on where the claim is being held at the time of report refresh.
- Account - MedInformatix Account Number
- Apptno - MedInformatix Appointment Number, to be used on the charge/claim
- Charge ID - MedInformatix Charge ID (CLCHARGE.CHGID)
- HDL Claim ID - HDL claim ID (hdl_masterclaim.masterClaimID)
- HL7 Message ID - HL7 message ID (from the DFT)
- CPT - from the MedInformatix fee schedule or selected in the HDL or received from the hospital, depending on where the claim is being held at the time of report refresh.
- Charges - total unbilled charge amount (in CLCHARGE, BILLED=U OR in hdl_masterclaim, masterClaimStatus is not complete, duplicate, or deleted (and charge and batch are not duplicate/deleted) OR in CLHL7DFTIMPORT, STATUS is not imported, duplicate, or deleted, depending on where the claim is being held at the time of report refresh).
- Units - total unbilled charge units (in CLCHARGE, BILLED=U OR in hdl_masterclaim, masterClaimStatus is not complete, duplicate, or deleted (and charge and batch are not duplicate/deleted) OR in CLHL7DFTIMPORT, STATUS is not imported, duplicate, or deleted, depending on where the claim is being held at the time of report refresh).
- TOS2 - TOS2, as indicated in the fee schedule associated to the CPT received/selected.
Days to Bill
Data Source: [dbo].[pbi_rcm_billing_lag] = view of CLCHARGE, CLCLAIM, CLNAME, CLINS, CLFSCHED, hdl_charges_log, hdl_charges, hdl_masterclaim, clhl7dftimport
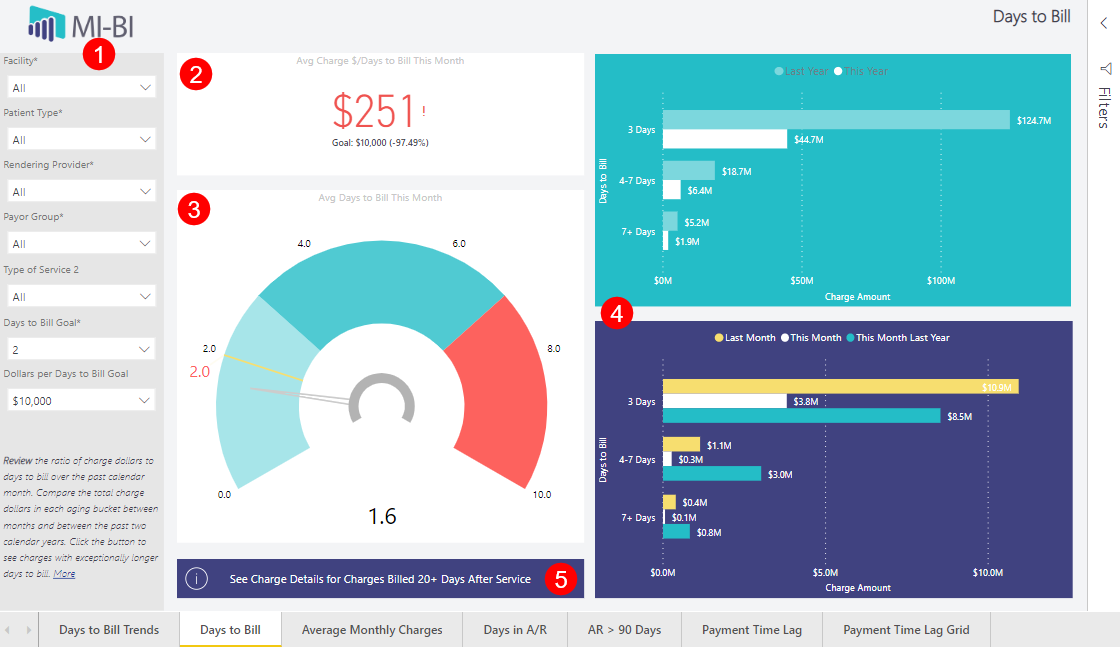
Slicers:
- Facility* - Service facility by default, and available as a report-level filter. Synced throughout report.
- Dollars per Days to Bill Goal - hard-coded in the report as $1,000, $10,000, $100,000, $250,000, $500,000, and $1,000,000 (default is $10,000). Affects the color of the KPI card text.
- Days to Bill Goal* - hardcoded in the report as 1-10, 14, and 28 (default is 2). Affects the target value on the “Avg Days to Bill This Month” gauge. Synced with Days to Bill Trends and Days to Bill pages.
- Type of Service 2 - TOS2, as indicated in the fee schedule (typically the department associated to the charge).
- Payor Group* - primary insurance insclass (new to v7.7).
- Rendering Provider* - associated to clcharge.rdoc and the service facility. Synced throughout report wherever slicer is visible.
- Patient Type* – Assigned from the charge (NOT patient-level or from the primary ins). Synced with Days to Bill Trends and Days to Bill pages.
Note: Other page-level filters relevant to the data source are available (e.g. fee type, TOS 1 - 4).
Avg charge $/Days to Bill This Month KPI Card
- Total billed charge amount divided by (total number of working days between the service date and bill date divided by total number of charges), where the bill date is in the current month as of the last refresh.
- Text color depends on whether the value ($) is above (green) or below (red) the selected Dollars per days to Bill Goal. Corresponding exclamation (!) appears when the threshold is exceeded. Checkmark when the average is below the threshold.
Avg Days to Bill This Month Gauge – Monitor days to bill for the current month-to-date.
- Total number of working days between service date and bill date divided by total number of charges, where the bill date is in the current month as of the last refresh.
- Target on gauge corresponds to selected Days to Bill Goal (default is 2).
- Gauge color-coded ranges are hard coded: 1-3, 3-7, and 7-10. 10 is the maximum value.
Days to Bill vs Charge Amount Bar Charts – Monitor performance measured in days to bill buckets and compare this year to last year, and this month to last month and the same month last year.
- Billing Lag Bucket – Total number of working days between service date and bill date.
- Period – Calendar year of bill date.
- Billed Charge Amount – Total dollars billed.
- Billed Charge Volume – Distinct count of charge line items.
Charge Details for Charges Billed 20+ Days After Service
Data Source: [dbo].[pbi_rcm_billing_lag_details_20days] = view of CLCHARGE, CLCLAIM, CLNAME, CLINS, CLFSCHED, hdl_charges_log, hdl_charges, hdl_masterclaim, clhl7dftimport, where the difference between CLCHARGE.XACDATE and CLCHARGE.BILLDATE is 20 or more working days, and the charge was billed in the past two calendar years
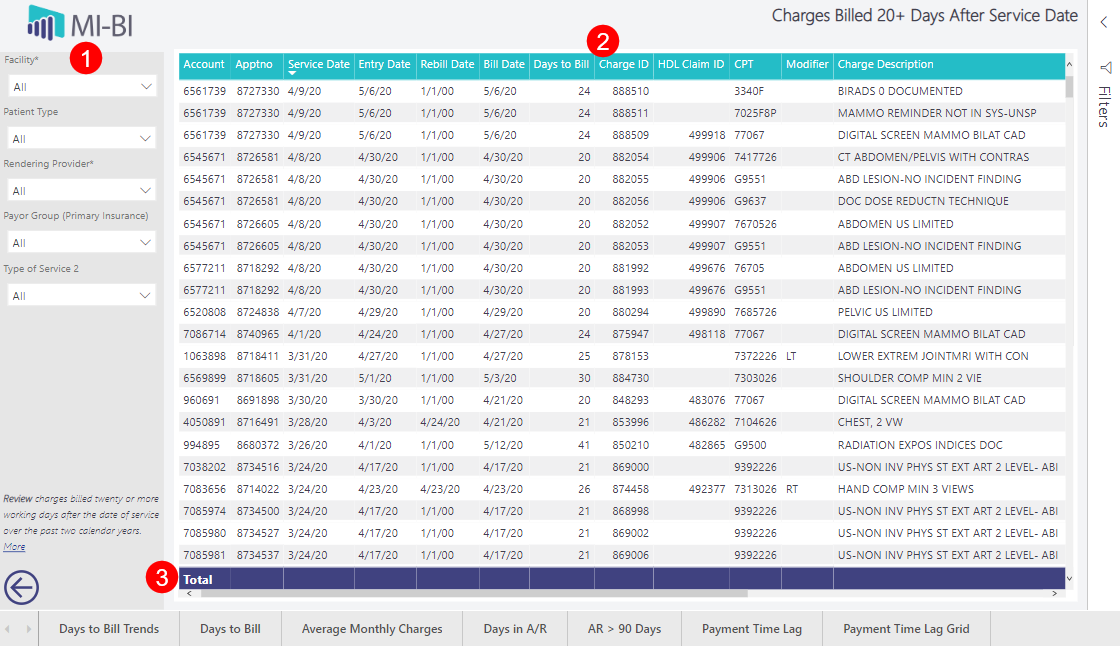
Slicers:
- Facility – Service facility by default, and available as a report-level filter. Synced throughout report.
- Patient Type – Assigned from the charge.
- Rendering Provider – Associated to clcharge.rdoc and the service facility. Synced throughout report wherever slicer is visible.
- Payor Group – Primary insurance insclass.
Note: Other page-level filters relevant to the data source are available (e.g. fee type, TOS 1 - 4).
Columns:
- Account – MedInformatix Account Number
- Apptno – MedInformatix Appointment Number, used on the charge/claim
- Service Date – date of service, as indicated on the MedInformatix claim
- Entry Date – MedInformatix charge entry date
- Rebill Date – MedInformatix charge rebill date
- Bill Date – Date the MedInformatix claim was billed
- Days to Bill – total number of working days (i.e. days on which a charge was entered) between service date and bill date
- Charge ID – MedInformatix Charge ID (CLCHARGE.CHGID)
- HDL Claim ID – HDL claim ID (hdl_masterclaim.masterClaimID)
- CPT – CPT from the MedInformatix fee schedule (CLFSCHED.CPTPRINT)
- Modifier – the CPT modifier added to the charge on the claim
- Charge Description – the procedure description, as indicated by the fee schedule
- Charges – the charge amount associated to the CPT, as indicated by the fee schedule
- Charge Units – billed charge units associated to the charge/CPT
- Charge Volume – a count of charge line item
- Payor Group – primary insurance's insclass
- User – CLUSER.MAILNAME associated to the user who entered the charge
Totals – Charge amount, units and charge volume totals
Average Monthly Charges by Service Date or Charge Entry Date
Data Source: [dbo].[pbi_rcm_average_monthly] = view of CLCHARGE, CLMASTER, CLDOCTOR, CLFAC, CLFSCHED, CLCLAIM, CLNAME, where the service date OR charge entry date is between Jan 1 of the previous year and today.
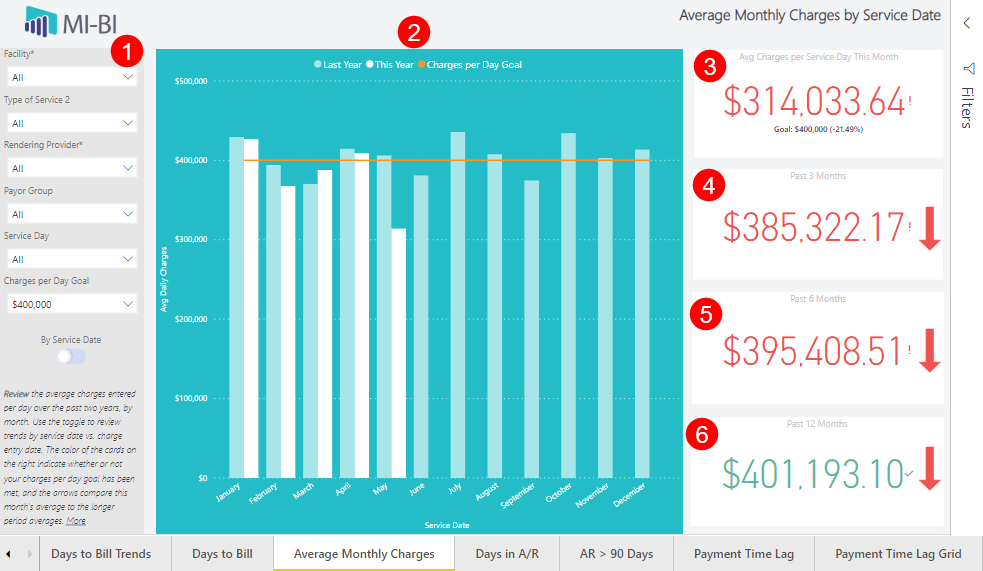
Slicers:
- Facility* – Service facility by default and available as a report-level filter. Synced throughout report.
- Toggle – By Service Date or Charge Entry Date Note: Other page-level filters relevant to the data source are available (e.g. fee type, TOS 1 - 4).
- Charges per Day Goal – hard-coded in the report as $1,000, $5,000, $10,000, $50,000, $100,000, $250,000, $500,000, and $1,000,000 (default is $250,000). Affects the color of each KPI card text.
- Service Day – day of the week corresponding to the service date associated to the charge or the charge entry date.
- Payor Group – primary insurance insclass.
- Rendering Provider* – associated to clcharge.rdoc and the service facility. Synced throughout report wherever slicer is visible.
- Type of Service 2 – TOS2, as indicated in the fee schedule (typically the department associated to the charge).
Average Daily Charges by Month Clustered Column Chart
- Avg Daily Charges by month – total charge amount divided by distinct number of service date or charge entry date, where the service/charge entry date is in the given month and year.
- Last Year/This Year clustered columns - compare the average daily charges for the displayed month between last year (light blue) and this year (white).
- Charges per Day Goal - orange constant line corresponds to goal selected in the Charges per Day Goal slicer.
- Service Date/Charge Entry Date - date of service or date charge was entered (from CLCHARGE).
Avg Charges per Service Day This Month KPI Card
- Total charge amount divided by total number of service or charge entry dates, where the service or charge entry date is in the current month, as of the time of the last refresh.
- Text color depends on whether the value is above or below the selected Charges per Day Goal. Corresponding exclamation (!) will appear if goal is not met, or checkmark if average is above goal.
Past 3 Months KPI Card
- Total charge amount divided by total number of service or charge entry dates, where the service or charge entry date is in the past 3 months, as of the time of the last refresh.
- A red down arrow will appear on the card if the current month average daily charges is lower than the 3-month average, and a green up arrow will appear if this month average is an improvement from the 3-month average.
- Text color depends on whether the value is above or below the selected Charges per Day Goal. Corresponding exclamation (!) will appear if goal is not met, or checkmark if average is above goal.
Past 6 Months KPI Card
- Total charge amount divided by total number of service or charge entry dates, where the service or charge entry date is in the past 6 months, as of the time of the last refresh.
- A red down arrow will appear on the card if the current month average daily charges is lower than the 6-month average, and a green up arrow will appear if this month average is an improvement from the 6-month average.
- Text color depends on whether the value is above or below the selected Charges per Day Goal. Corresponding exclamation (!) will appear if goal is not met, or checkmark if average is above goal.
Past 12 Months KPI Card
- Total charge amount divided by total number of service or charge entry dates, where the service or charge entry date is in the past 12 months, as of the last refresh.
- A red down arrow will appear on the card if the current month average daily charges is lower than the 12-month average, and a green up arrow will appear if this month average is an improvement from the 12-month average.
- Text color depends on whether the value is above or below the selected Charges per Day Goal. Corresponding exclamation (!) will appear if goal is not met, or checkmark if average is above goal.
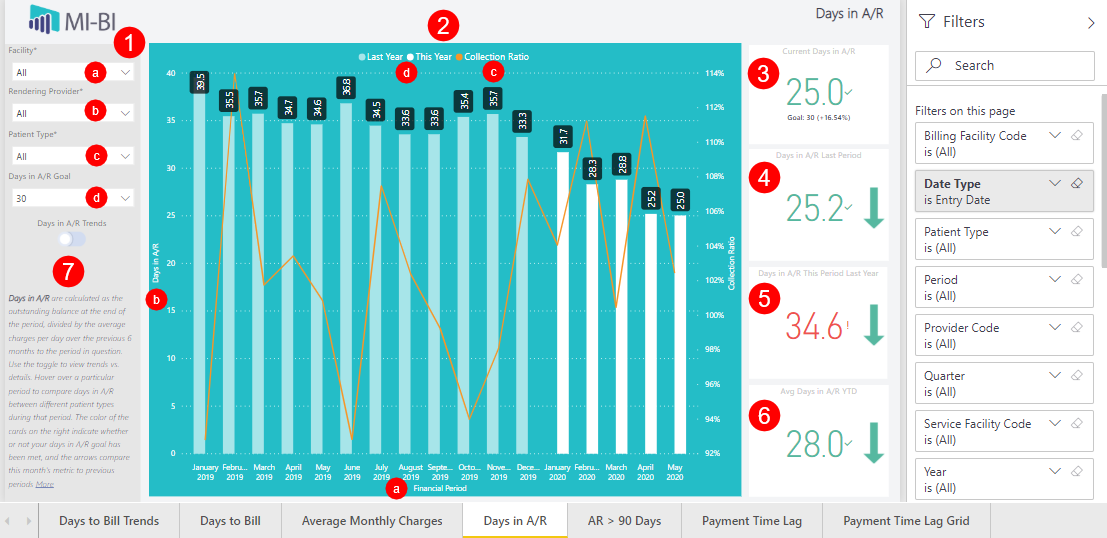
Days in A/R
Data source: [dbo].[pbi_rcm_financials_trendingar] = view of CLBALSUMHIST, CLCHARGE, CLDOCTOR, and CLFAC where the period (entry date) is between January 1 of the previous year and today.
Slicers:
- Facility* - Service facility by default, also available as a report-level filter. Synced throughout report.
- Toggle – Changes the large visual, not the KPI card values. Days in A/R Trends or Days in A/R Details (see details below)
- Days in A/R Goal - hard-coded in the report as 5, 10, 15, 20, 25, 30-50, 55, 60, 65, 70, and 75 (default is 30). Affects the color of each KPI card text. This is the only page that uses this slicer.
- Patient Type* - from the charge (NOT patient-level or from the primary insurance). Synced with Days in A/R and AR > 90 Days pages only.
- Rendering Provider* - associated to clcharge.rdoc and the service facility. Synced throughout report wherever slicer is visible.
Note: Other page-level filters relevant to the data source are available e.g. year, provider code, etc.
Days in A/R Trends Line and Clustered Column Chart (Days in A/R Trends toggle selected)
- Financial Period - financial period (month) defined in the dimrun cutoff job.
- Days in A/R - Total A/R divided by Average Daily Charges (calculated from the previous 6 months), where:
- Total A/R - total balance at the end of the displayed period, as captured nightly by the dimrun cutoff job.
- Average Daily Charges - (Charges in 6-Month Period)/(Days in 6-Month Period).
- Charges in 6-Month Period - gross charges entered between 7 months prior and one month prior to the displayed period (total charges entered in the 6 months prior to the displayed period).
- Days in 6-Month Period - total days present in the 6 months prior to the displayed period.
- Collection Ratio – credits divided by charges.
- Last year (20XX) label is dynamic based on the current year, and shown in a light teal color, while This Year (20XX) trends will be shown in white.
Note: Hover over a column or the trendline to see a column chart of Days in A/R by Patient Type for the selected period.
Note: Use the toggle to see these details for each period (Days in A/R Details).
Current Days in A/R KPI Card
- Displays Days in A/R for the current financial period (see reference to calculation above).
- Text color depends on whether the value is above (green) or below (red) the selected Days in A/R Goal. Corresponding exclamation (!) will appear if goal is not met (too high), or checkmark if the current Days in A/R value is below the goal.
Days in A/R Last Period KPI Card
- Displays Days in A/R for the previous financial period (see reference to calculation above).
- Green down arrow appears when the current period Days in A/R is lower than the previous period value. Red up arrow will appear if this period value is higher than the previous period value.
- Text color depends on whether the value is above (green) or below (red) the selected Days in A/R Goal. Corresponding exclamation (!) will appear if goal is not met (too high), or checkmark if the current Days in A/R value is below the goal.
Days in A/R This Period Last Year KPI Card
- Displays Days in A/R for this financial period one year ago (see reference to calculation above).
- Green down arrow appears when the current period Days in A/R is lower than the "this period last year" value, and a red up arrow will appear if this period value is higher than it was at this same time last year.
- Text color depends on whether the value is above (green) or below (red) the selected Days in A/R Goal. Corresponding exclamation (!) will appear if goal is not met (too high), or checkmark if the current Days in A/R value is below the goal.
Avg Days in A/R YTD KPI Card
- Displays the Average Days in A/R between every period in the current year (see reference to calculation above).
- Green down arrow appears when the current period Days in A/R is lower than the Avg YTD value, and a red up arrow appears if this period value is higher than it was on average over this past year.
- Text color depends on whether the value is above (green) or below (red) the selected Days in A/R Goal. Corresponding exclamation (!) will appear if goal is not met (too high), or checkmark if the current Days in A/R value is below the goal.
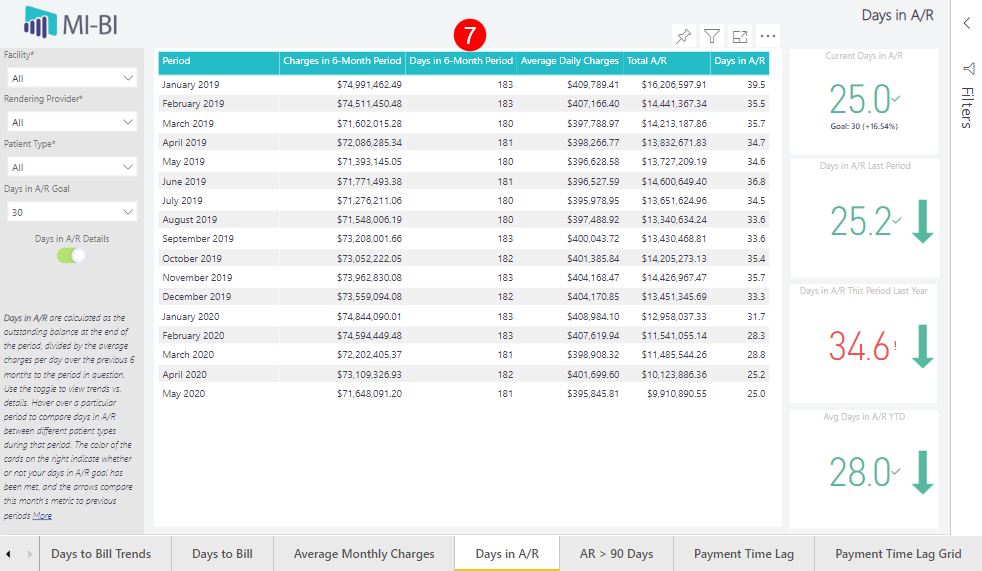
Days in A/R Details Matrix (Days .in A/R Details toggle selected)
- Period - financial period (month) defined in the dimrun cutoff job.
- Days in A/R - Total A/R divided by Average Daily Charges, calculated from the previous 6 months.
- Total A/R - total balance at the end of the displayed period, as captured nightly by the dimrun cutoff job.
- Average Daily Charges - Charges in 6-Month Period divided by Days in 6-Month Period.
- Days in 6-Month Period - total days present in the 6 months prior to the displayed period.
- Charges in 6-Month Period - gross charges entered between 7 months prior and one month prior to the displayed period (total charges entered in the 6 months prior to the displayed period).
Note: Hover over any field in the matrix to see a column chart of Days in A/R by Patient Type for the selected period.
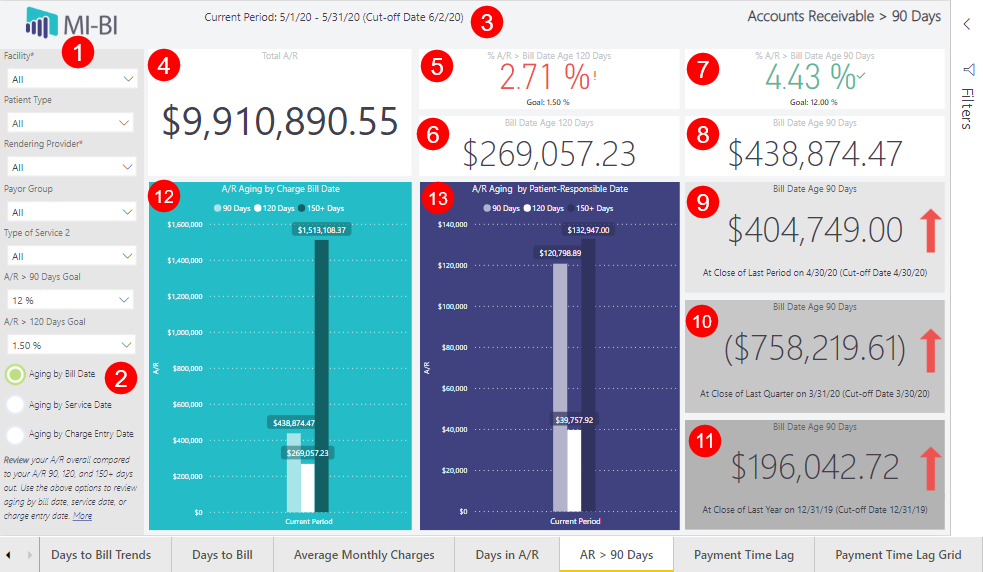
AR > 90 Days
Visualize outstanding Accounts Receivable in aging buckets by preferred date event.
Data Source: [dbo].[pbi_rcm_aging_comparison] = view of CLCHARGE, CLPAYMNT, CLDOCTOR, CLDIMRUN_CUTOFFDATE, CLMASTER, CLFAC, CLFSCHED, CLCLAIM, CLNAME, and CLINS where the charge entry date and the payment entry dates are before the period cutoff date, and the service date and the pay dates are before the period stop date (where the periods from CLDIMRUN_CUTOFFDATE are current, last period, the last period of last quarter, and the last period of last year)
Slicers:
- Facility* - Service facility by default, also available as a report-level filter. Synced throughout report.
- Patient Type - from the charge (NOT patient-level or from the primary ins). Not synced with the same slicer on any other page.
- Rendering Provider* - associated to clcharge.rdoc and the service facility. Synced throughout report wherever slicer is visible.
- Payor Group - primary insurance's insclass. Not synced with any other page.
- Type of Service 2 - TOS2, as indicated in the fee schedule (typically the modality/department associated to the charge). Not synced with the same slicer on any other page.
- A/R > 120 Days Goal - hard-coded in the report as 0.5%-6%, 7%, 8%, 9%, and 10% (default is 1.5%). Affects the color of each KPI card text. This is the only page that uses this slicer.
- A/R > 90 Days Goal - hard-coded in the report as 5% - 25% (default is 12%). Affects the color of each KPI card text. This is the only page that uses this slicer.
Note: Other page-level filters relevant to the data source are available e.g. charge status, TOS 1 - 4, etc.
Radio Buttons – Click to track aging by preferred date event (this page only).
- Aging by Bill Date
- Aging by Charge Entry Date
- Aging by Service Date
Current Period date range – Date range of current period, as stored in CLDIMRUN_CUTOFFDATE (date range itself defines the date of service period, whereas the cut-off date limits the charge/payment entry date for this period).
Total A/R KPI Card
- Total balance as of last report refresh, calculated in the same manner as the dimrun cutoff job (should match the total A/R for the current period displayed on the Days in A/R details toggle).
% A/R > Bill/Service/Entry Date Age 120 Days KPI Card
- Percent of the total current A/R that is 120 - 149 days old.
- Text color depends on whether the value is above (green) or below (red) the selected A/R > 120 Days Goal. Corresponding exclamation (!) appears when goal is not met (too high), or checkmark if the current % A/R older than 120 days value is below the goal.
- Age is calculated as the difference between the charge bill date or service date or charge entry date and the period end date, depending on which radio button is selected.
Bill/Service/Entry Date Age 120 Days KPI Card
- Current A/R (total balance) that is 120 - 149 days old, where age is calculated as the difference between the charge bill date or service date or charge entry date and the period end date, depending on which radio button is selected.
% A/R > Bill/Service/Entry Date Age 90 Days KPI Card
- Percent of the total current A/R that is 90 - 119 days old.
- Age is calculated as the difference between the charge bill date or service date or charge entry date and the period end date, depending on which radio button is selected.
- Text color depends on whether the value is above (green) or below (red) the selected A/R > 90 Days Goal. Corresponding exclamation (!) appears when goal is not met (too high), or checkmark if the current % A/R older than 90 days value is below the goal.
Bill/Service/Entry Date Age 90 Days KPI Card
- Current A/R (total balance) that is 90 - 119 days old, where age is calculated as the difference between the charge bill date or service date or charge entry date and the period end date, depending on which radio button is selected.
Bill/Service/Entry Date Age 90 Days at Close of Last Period KPI Card
- A/R (total balance) that was 90 - 119 days old at the close of the last period, where age is calculated as the difference between the charge bill date or service date or charge entry date and the period end date, depending on which radio button is selected.
- The close of last period date listed below the card is the cut-off for the service date, whereas the cut-off date listed is the cut-off for the charge/payment entry dates (as stored in CLDIMRUN_CUTOFFDATE).
- Green down arrow appears when the current period Bill or Service or Entry Date Age 90 Days is lower than the previous period value, and a red up arrow appears if this period value is higher than the previous period value.
Bill/Service/Entry Date Age 90 Days at Close of Last Quarter KPI Card
- A/R (total balance) that was 90 - 119 days old at the close of the last quarter, where age is calculated as the difference between the charge bill date or service date or charge entry date and the period end date, depending on which radio button is selected.
- The close of last quarter date listed below the card is the cut-off for the service date, whereas the cut-off date listed is the cut-off for the charge/payment entry dates (as stored in CLDIMRUN_CUTOFFDATE).
- Green down arrow appears when the current period Bill or Service or Entry Date Age 90 Days is lower than the close of last quarter value, and a red up arrow appears if this period value is higher than the close of last quarter value.
Bill/Service/Entry Date Age 90 Days at Close of Last Year KPI Card
- A/R (total balance) that was 90 - 119 days old at the close of the last year, where age is calculated as the difference between the charge bill date or service date or charge entry date and the period end date, depending on which radio button is selected.
- The close of last year date listed below the card is the cut-off for the service date, whereas the cut-off date listed is the cut-off for the charge/payment entry dates (as stored in CLDIMRUN_CUTOFFDATE).
- Green down arrow appears when the current period Bill or Service or Entry Date Age 90 Days is lower than the close of last quarter value, and a red up arrow appears if this period value is higher than the close of last quarter value.
A/R Aging by Charge Bill/Service/Entry Date Column Chart
- Shows the total A/R (balance) as of last report refresh that is in the 90-119, 120-149, and 150+ days old aging buckets, where age is calculated as the difference between the charge bill date or service date or charge entry date and the period end date, depending on which radio button is selected.
A/R Aging by Patient-Responsible Date Column Chart
- Shows the total A/R (balance) that is patient-responsible (clcharge.copay) as of last report refresh that is in the 90-119, 120-149, and 150+ days old aging buckets, where age is calculated as the difference between the date that the charge was made patient-responsible and the period end date.
- This visual will stay the same, regardless of which radio button is selected.
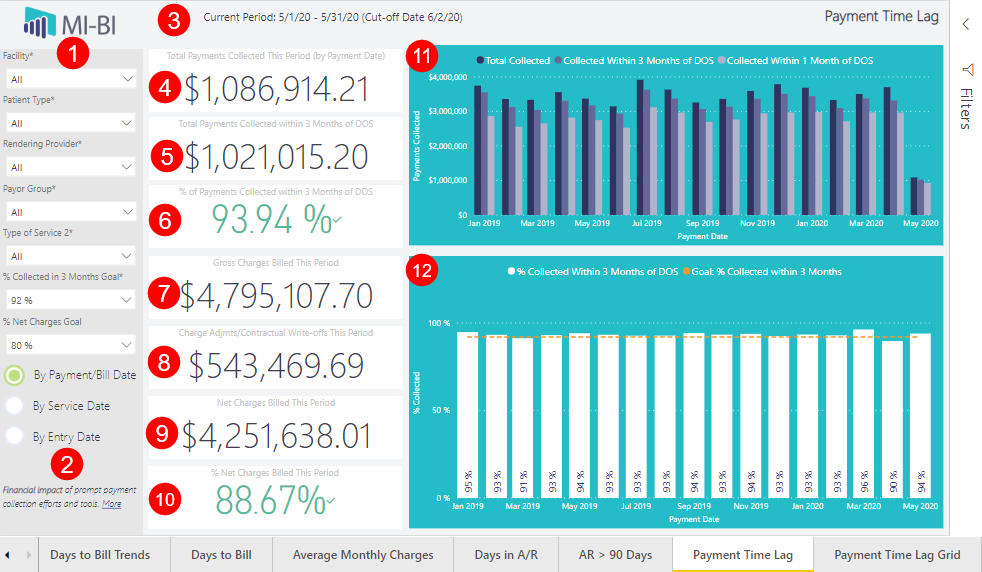
Payment Time Lag
- Slicers:
- Facility* – Service Facility by default, also available as a report-level filter. Synced throughout report.
- Patient Type* From the charge, not patient-level or from the primary insurance. Synced with Days to Bill Trends and Days to Bill pages.
- Rendering Provi-der *– Associated to clcharge.rdoc and the service facility. Synced throughout report wherever the slicer is visible.
- Payor Group* – Primary insurance insclass.
- Type of Service 2* – TOS2, as indicated in the fee schedule (typically the modality/department associated to the charge). Not synced with any other page.
- % Collected in 3 Months Goal – Hard-coded in the report as 85-95%. Default is 92%. Affects the color of the KPI card text. Synced here and Payment Time Lag Grid page only.
- % Net Charges Goal – Hard-coded in the report. Default is 80%. Affects the color of the KPI card text.
- Note: Other page-level filters are available in the Filters pane, including TOS 1-4.
- Radio Buttons – click to track payment collections by preferred date event. See explanations below for each KPI Card and chart visual.
- By Payment/Bill Date
- By Service Date
- By Entry Date
- Current Period Date Range – Date range of the current period, as stored in CLDIMRUN_CUTOFFDATE. The date range itself defines the date of service period, and the cut-off date limits the charges and payment entry dates for this period.
- Total Payments Collected This Period (by Payment Date) KPI Card – Sum of all actual dollars
collected this period, when the payment status is active and the payment was made by the guarantor, insurance carrier or on-account
- Payment date/Service date/Payment Entry date is within the current financial period, as defined by the dimrum job this month. Payment entry date is prior to the current period cutoff date.
- Value matches the last column in each chart for total amount ($) collected.
- Total Payments Collected within 3 Months of DOS KPI Card – Sum of all actual dollars collected this period, when the payment status is active and the payment was made by the guarantor, insurance carrier or on-account.
- Payment date is within the current financial period, as defined by the dimrun job this month and payment date is within 3 months of the service date.
- Service date is within is within the current financial period, as defined by the dimrun job this month and payment entry date is within 3 current financial periods of the date of service (made prior to the cutoff date 3 months from the date of service).
- Payment entry date is within is within the current financial period, as defined by the dimrun job this month and the payment entry date is within 3 current financial periods of the date of service (made prior to the cutoff date 3 months from the date of service).
- Value matches the last column in each chart for amount ($) collected within 3 months.
- % of Payments Collected within 3 Months of DOS KPI Card – Total payments collected within 3 months of service date divided by total payments collected this period.
- Text color depends on if the value is above or below the selected Goal (page slicer).
- Corresponding “!” if goal is not met (collection rate is lower) or checkmark if goal is met (collection rate is higher).
- Gross Charges Billed This Period KPI Card – Sum of total charges this period by bill date within the current financial period, as defined by the dimrun job this month.
- Bill date is within the current financial period.
- Service date is within the current financial period.
- Charge entry date is within the current financial period.
- Charge Adjmts/Contractual Write-offs This Period KPI Card – Sum of total charge adjustments and contractual write-offs excluded from next charges calculation. Exclusions determined at report installation and
stored in CLVALUESETS (code = CLPAYMNT.PAYORCODE, section = pbi_rcm_kpis_ChgExcl).
- Charge bill date associated to the adjustment or write-off that is within the current financial period, as defined by the dimrun job this month.
- Service date is within the current financial period, as defined by the dimrun job this month, and the payment entry date is prior to the current period cutoff date.
- Charge entry date and payment (adj/write-off) entry date are both within the current financial period as defined by the dimrun job and made prior to the cutoff date.
- Net Charges Billed This Period KPI Card – Gross charges minus charge adjustments and contractual write-offs billed this period.
- % Net Charges Billed This Period KPI Card – Net charges divided by gross charges.
- Text color depends on if the value is above or below the selected Goal (page slicer).
- Corresponding “!” if goal is not met (collection rate is lower) or checkmark if goal is met (collection rate is higher).
- Payments Collected by Period Clustered Column Chart – Sum of all actual dollars collected compared to actual dollars collected within 3 months or 1 month from the date of service, by financial period, where the
payment status is active and payment made by guarantor, insurance carrier or on-account.
- By Payment Date – Sum of all payments, displayed by month/year of the payment date, compared to those payments with a payment date within 3 months/1 month of the service date.
- By Service Date – Sum of all payments, displayed by month/year of the service date, compared to payment entry dates within 3 periods, and 1 financial period, of the date of service, as defined by the dimrum job and made prior to the cutoff date 3 months from the date of service.
- By Entry Date – Sum of all payments, displayed by month/year of financial period containing the payment entry date, as defined by the dimrun jobs and the cutoff date used each month, compared to those with a payment entry date within 3 periods, and 1 financial period, of the date of service, as defined by the dimrun job and made prior to the cutoff date 3 months from the date of service.
- Tooltip (hover) shows the dollar amount for the selected column, percent collected within 3 months, and within 1 month of the service date, and the selected goal.
- % Collected Within 3 Months of DOS Column and Line Chart – Total payments collected within 3 months of the date of service divided by the total payments collected this period. Dotted line corresponds to the selected
goal (page slicer).
- By Payment Date – Sum of all payments, displayed by month/year of the payment date, compared to those payments with a payment date within 3 months of the service date.
- By Service Date – Sum of all payments, displayed by month/year of the service date, compared to those with a payment entry date within 3 current financial periods of the date of service, as defined by the dimrun job and made prior to the cutoff date 3 months from the date of service.
- By Entry Date – Sum of all payments, displayed by month/year of the financial period containing the payment entry date, compared to those with a payment entry date within 3 current financial periods of the date of service, as defined by the dimrun job and made prior to the cutoff date 3 months from the date of service.
- Tooltip (hover) shows the period (month/year), percent collected within 3 months, total dollars collected, and dollar amount collected within 3 months.
Payment Time Lag Grid
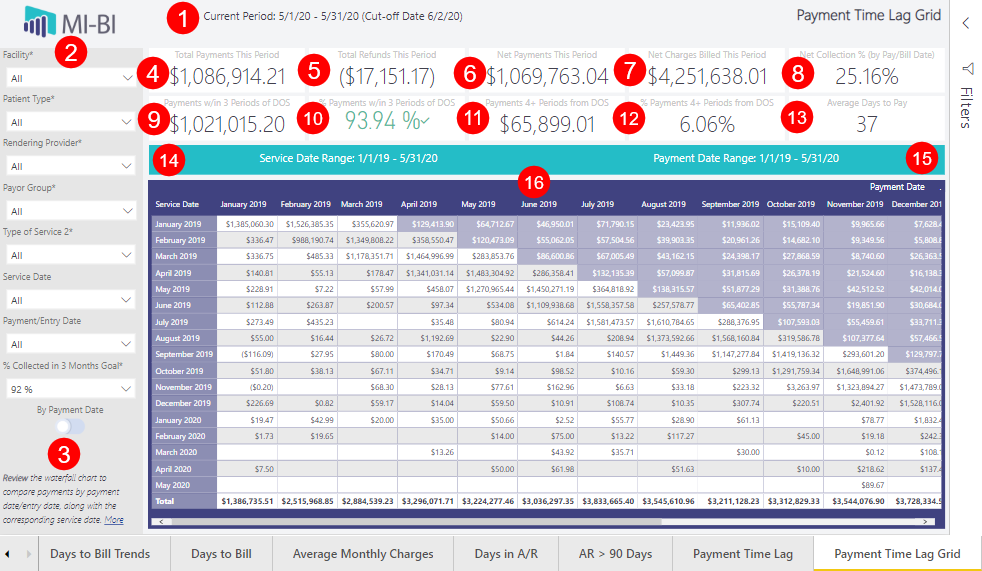
Current Period Date Range KPI Card
- Date range of current period (CLDIMRUN_CUTOFFDATE).
- Cut-off date limits the charge/payment entry date for this period.
- Date range defines the service period.
Slicers:
- Facility* – Service facility by default, also available as a report-level filter. Synced throughout report.
- Patient Type* – From the charge (NOT patient-level or from the primary ins). Synced on the Payment Lag pages only.
- Rendering Provider* – Assoiated to clcharge.rdoc and the service facility. Synced throughout report wherever slicer is visible. c
- Payor Group – Primary insurance's insclass. Synced on the Payment Lag pages only.
- Type of Service 2* – TOS2, as indicated in the fee schedule (typically the modality/department associated to the charge). Not synced with any other page.
- Service Date – Month/year of the service date corresponding to the payment/charge. Not synced with any other page.
- Payment/Entry Date – Month/year of the selected payment date or payment/charge entry date corresponding to the payment/charge, depending on which toggle is selected. Not synced with any other page.
- % Collected in 3 Months Goal – Hard-coded in the report as 85-95%. Default is 92%. Affects the color of the KPI card text. Synced on the Payment Lag pages only.
Toggle
- Track payments by the preferred date event. See explanation below for each KPI card and chart visual.
- By Payment Date – Payment date associated with the payment line item.
- By Entry Date – Date payment was entered into MedInformatix.
Note: Other page-level filters are available in the Filters pane, including TOS 1-4.
Total Payments [Entered] This Period KPI Card
- Sum of all actual dollars collected.
- Payment status is active, and payment was made this period by guarantor, insurance carrier or was an on-account payment.
- By payment date – payment date is within the current financial period, as defined by dimrun job this month.
- By entry date – payment entry date is within the current financial period, as defined by the dimrun job made prior to the cutoff date, and payment entry date is prior to the current period's cutoff date.
- Matches “Total Payments Collected This Period” KPI card on the Payment Time Lag page.
Total Refunds (Entered) This Period KPI Card
- Sum of total refunds excluded from net payments calculation. Exclusion determined at report installation and stored in CLVALUESETS (code = CLPAYMNT.PAYORCODE, section = pbi_rcm_kpis_refund).
- By Payment Date – Payment date associated to the refund adjustment/write-off code is within the current financial period, as defined by the dimrun job this month.
- By Entry Date – Payment entry date is within the current financial period, as defined by the dimrun job and made prior to the cutoff date.
Net Payments (Entered) This Period KPI Card
- Gross Payments - Total Payments (Entered) This Period minus Refunds (Total Refunds (Entered) This Period.
- Calculation is the same when viewing page by payment/bill date or entry date.
Net Charges Entered/Billed This Period KPI Card
- Gross Charges - Charge Adjustments/Contractual Write-offs.
- Matches the same KPI card on the Payment Time Lag page.
- Calculation is the same when viewing page by bill date or entry date.
Net Collection % (by Entry/Pay/Bill Date) KPI Card
- Net Payments divided by Net Charges.
- Calculation is the same when viewing page by bill date or entry date.
Payments w/in 3 Periods of DOS KPI Card
- Sum of all actual dollars collected this period, within 3 periods of the date of service.
- By entry date – made after the cutoff date 4 or more months from the date of service.
- By payment date – cutoff date is not used here since cutoff date is for entry dates only and payment date can be selected manually.
- Assumes payments status is active and payment was made by the guarantor, insurance carrier, or was on on-account payment.
% Payments w/in 3 Periods of DOS KPI Card
- Payments within 3 periods of date of service divided by total payments entered this period.
- Calculation is the same for by payment or entry date.
Payments 4+ Periods from DOS KPI Card
- Sum of all actual dollars collected this period where the payment was made 4 or more months after the date of service.
- By entry date – made after the date 4 or months from the date of service.
- By payment date – cutoff date is not used here since cutoff date is for entry dates only and payment date can be selected manually.
- Assumes payment status is active and payment was made by the guarantor, insurance carrier or was an on-account payment.
% Payments 4+ Periods from DOS KPI Card
- Payments 4 or more months from the date of service divided by total payments entered this period
- Calculation is the same for by payment or entry date.
Average Days to Pay KPI Card
- Total days between date of service and payment/entry date (not business days)
Service Date Range KPI Card
- Service dates considered in Waterfall Grid Matrix.
Payment (Entry) Date Range KPI Card
- Payment entry dates considered in Waterfall Grid Matrix.
Waterfall Chart/Payment Time Lag Grid Matrix
- Sum of all actual dollars collected for the given service period date and payment entry date.
- Payments with a pay date 4 or more periods past the date of service are shaded.
- Assumes payment status is active and payment was made by the guarantor, insurance carrier or was an on-account payment.