 MI CONTACT
OVERVIEW
A companion report to MI Contact to track key performance indicators (KPIs) and evaluate the effectiveness of your marketing outreach activities over the past 18 months. Track activities by type, marketer, specialty, date, and location with the ability to view activity details for relevant metrics.
-
KPIs are fixed, reliable, and comparable over time.
-
Monitor performance with a report optimized for mobile devices.
Requirements:
-
MI Contact
-
MedInformatix version 7.7 (recommended)
Definitions:
-
Activity – Outreach action logged in the MI Contact mobile app by a Marketer
-
Activity Type – The category of activity, as defined by each customer (e.g., Call, Email, Visit, Drop-off) in the MI Contact Admin Portal
-
Activity Target - The purpose of the activity, as defined by each customer in the MI Contact Admin Portal
-
Referral – The referring clinician (referral source) assigned to the activity
-
Referral Group – The practice assigned to the activity
-
Specialty – The medical specialty or type of practice assigned to the referring provider (referral source). The MI Contact mobile app referring provider specialty list syncs with the specialty and sub-specialty list maintained in MedInformatix as a Table Set. When not present in MedInformatix, the default MI Contact specialty list is used.
Pages
Activities by Type:
-
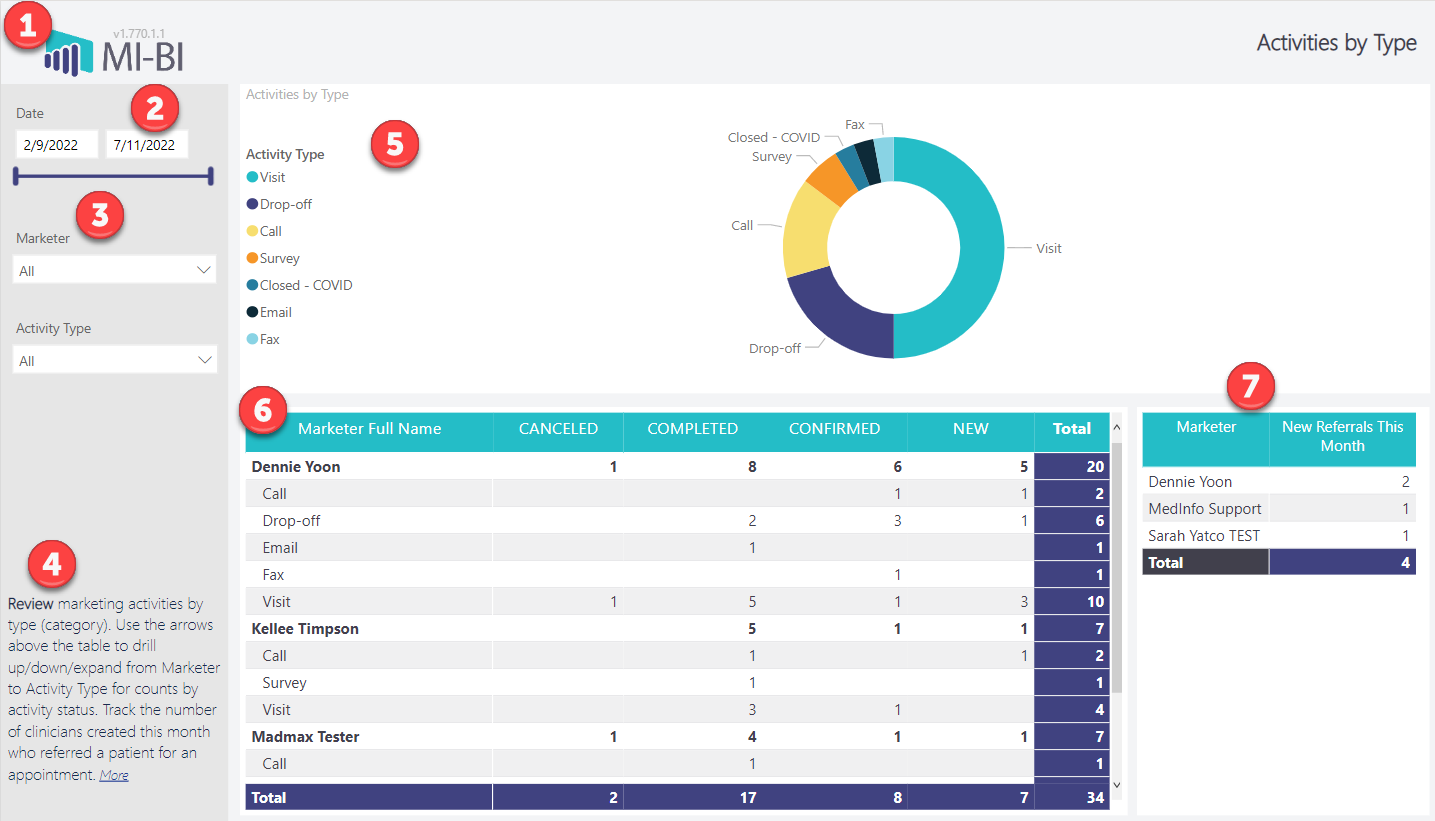
MI-BI Logo – Click to reset slicers to default values.
-
Date Range – Displays the actual date range available in the report. Use the slider or calendar date picker to select a custom date range. Note that any grayed-out dates are unavailable or not included in the current view.
-
Slicers:
-
Marketer – The user who created the activity
-
Activity Type – The category for the activity, as assigned by the user
-
Page Instructions – Brief description of the current page. Use the More link to access this report documentation in Resources.
-
Activities by Type (donut) – Proportional representation of activity types by the total number of activities logged. Hover over any type to view the count and percentage of the total. Right-click to drill through and view the activity details for that category.
-
Marketer Activities by Type and Status – The grid displays each marketer and the status of their activities. Use the arrows above the grid to drill down to view activity types or expand for activity types listed by each marketer. Sort by any column by clicking the header.
-
New Referrals This Month – A count of referring clinicians (referral source) created in the current month and associated with a scheduled appointment. When assigned, the marketer is also displayed.
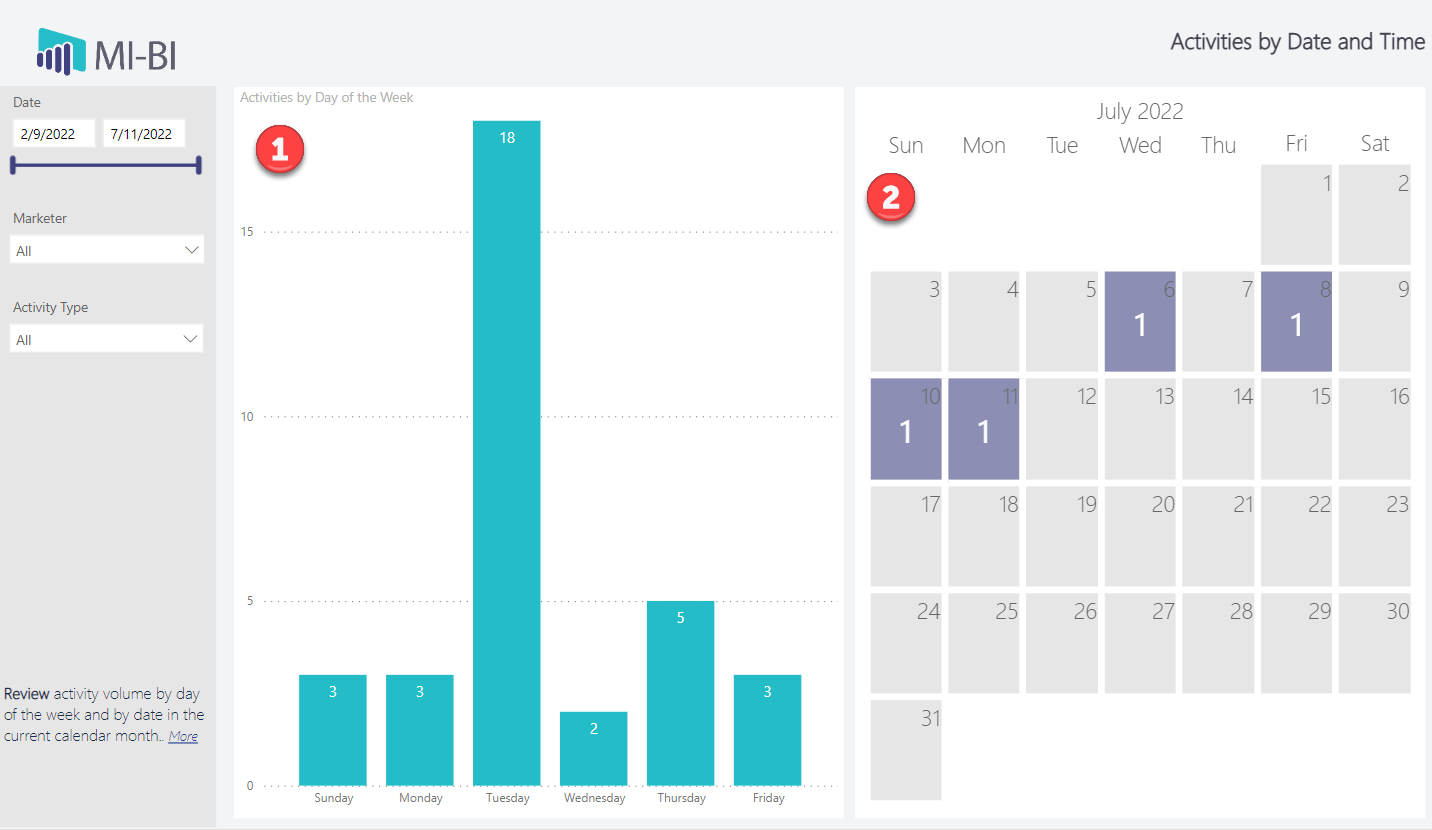
Activities by Date:
-
Activities by Day of the Week (column chart): Activities are counted and displayed by the day of the week within the selected date range.
-
Activities for This Month: Activities are counted and displayed by calendar date for the current month.
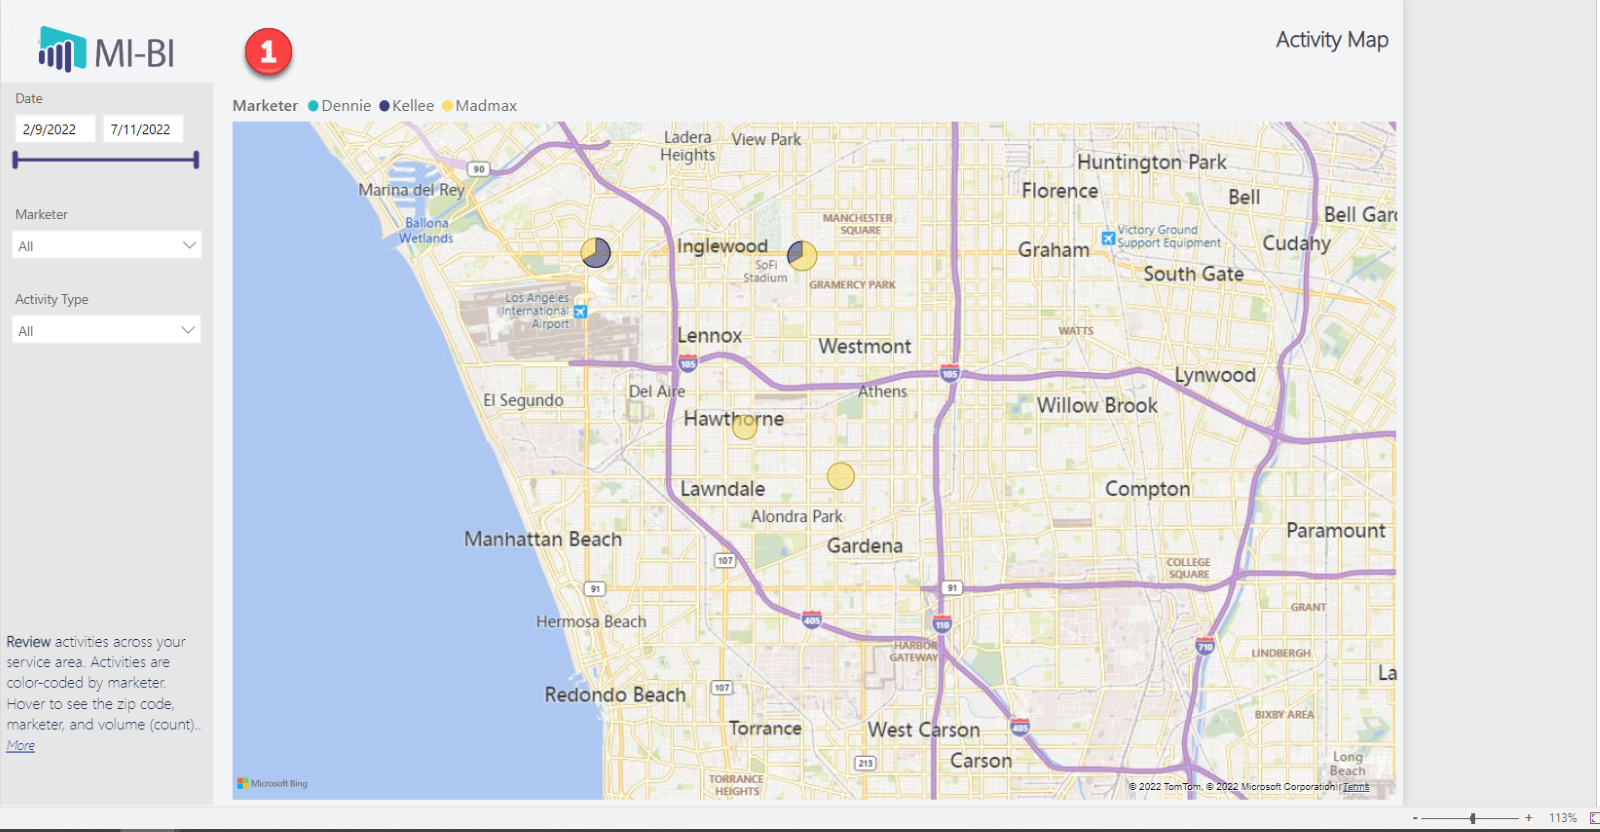
Activity Map:
-
Activity Map: View activities by location, based on the associated referral address. Activities associated only to a practice will not be displayed on the map, as practices are not associated to any one address. Activities are color-coded by marketer to visualize their territories. Hover on any activity to see the zip code, marketer, and volume (count). Use the mouse scroll wheel to zoom in and out of the map.
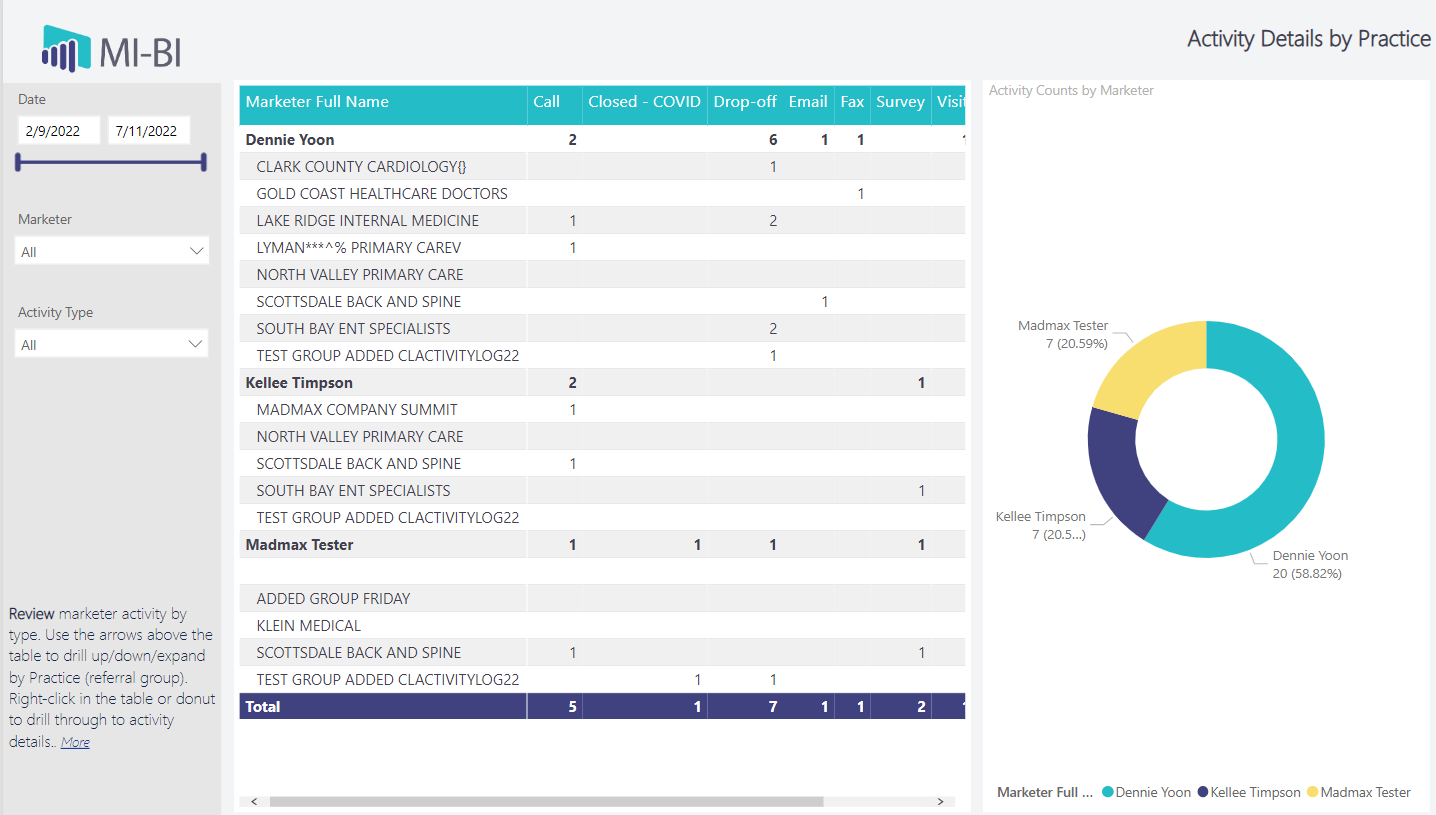
Activity Details by Practice
-
Activity Details by Practice: Each marketer is listed with a count of each activity type in a grid. Use the arrows above the grid to drill down to activity counts by Referral Group. Or use the expand arrow to view each practice by marketer. Sort by any column by clicking the column header. Right-click to drill through to view activity details. Note that if the activity is associated with a referral source who is not assigned to a referral group, then the Referral Group Name is blank.
-
Activities by Marketer (donut): Proportional representation of each marketer based on the total number of activities they created within the selected date range. Right-click to drill through to view activity details.
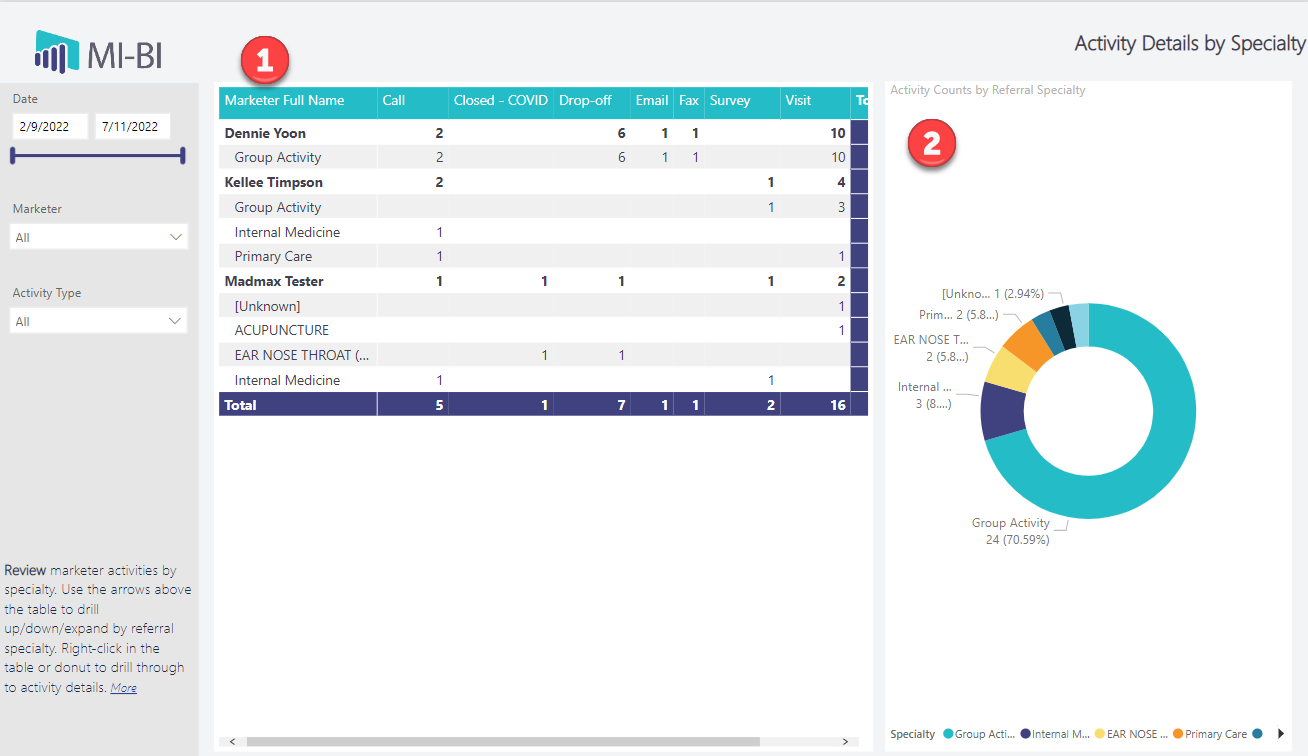
Activity Details by Specialty
-
Activity Details by Specialty: Each marketer is listed with a count of each activity type in a grid. Use the arrows above the grid to drill down to activity counts by Referral Specialty. Or use the expand arrow to view each specialty by marketer. Sort by any column by clicking the column header. Note that activities associated ONLY with a referral group (practice) and not an individual referring clinician are excluded from this table. Right-click any row to drill through and view the activity details.
-
Activities by Specialty (donut): Proportional representation of referring clinician specialty based on the total number of outreach activities created within the selected date range. Right-click any specialty to drill through and view the activity details.
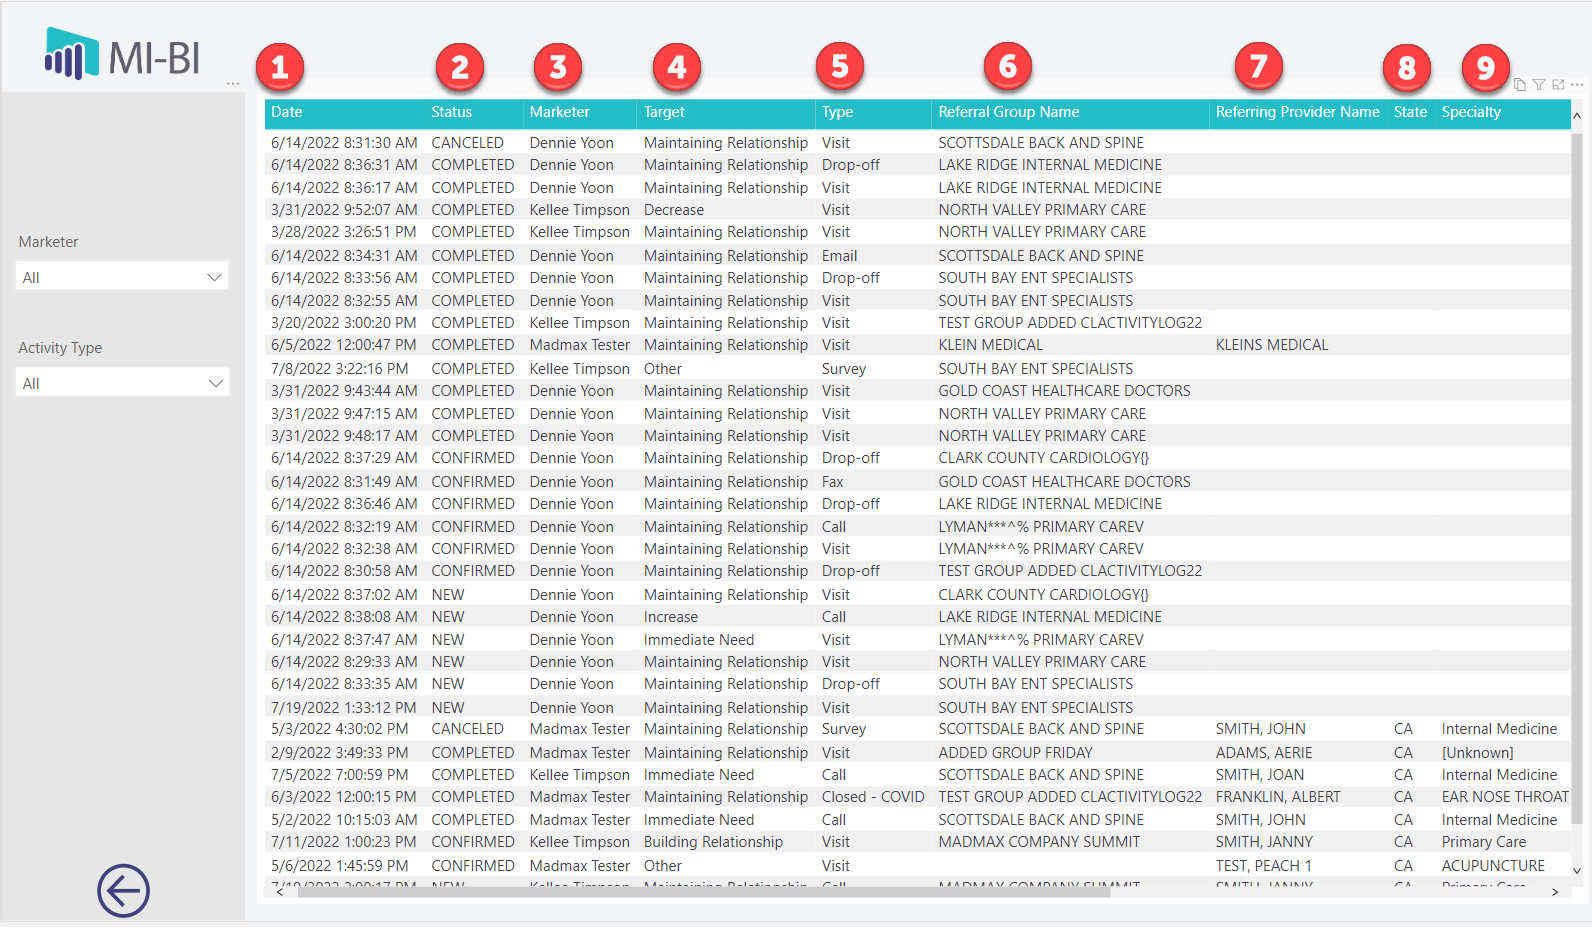
Activity Details
-
View details for all activities created within the selected date range. When you drill through from a previous page, you will only see the activities that meet the criteria for the selected metric and filters. Sort by any column by clicking the column header.
-
Grid Columns:
-
Date – The date the activity was performed
-
Status – The activity status
-
Marketer – The full name of the marketer who created/performed the activity
-
Target – The reason the outreach activity was performed
-
Type – The type of outreach activity performed
-
Referral Group Name – The practice associated with the activity, when applicable
-
Referring Provider Name – The referring provider associated with the activity, when applicable
-
State – State where the activity was performed, based on the referral or referral group location
-
Specialty – The clinician’s specialty, when a referring provider is associated with the activity
-
Zip – The zip code where the activity was performed, based on the referring provider’s location
-
Notes – Any activity notes entered by the marketer