
MI-BI: Denial Details
Summary:
· Denials processed for the past 4 months by remit pay date.
· Use page slicers to filter data.
· Date slicers apply filters only to that page; other slicers sync between pages.
· Reset to default settings by clicking the MI-BI logo.
· Hover or click on specific charts and graphs for tooltips with summary information.
· Cross-filter by clicking in charts to change the other visuals on the same page.
· By default, common contractual denial codes are excluded.
· Denials details are available on the last page of the report, “Details”, by right-clicking in the table/grid or within one of the charts and selecting “drillthrough”.
· Right-click options include:
o Drillthrough takes you to a page with standard slicers to filter data.
o Show data displays details on the same page.
o Include focuses chart to selected data element.
o Exclude removes selected data from chart.
Top Reasons
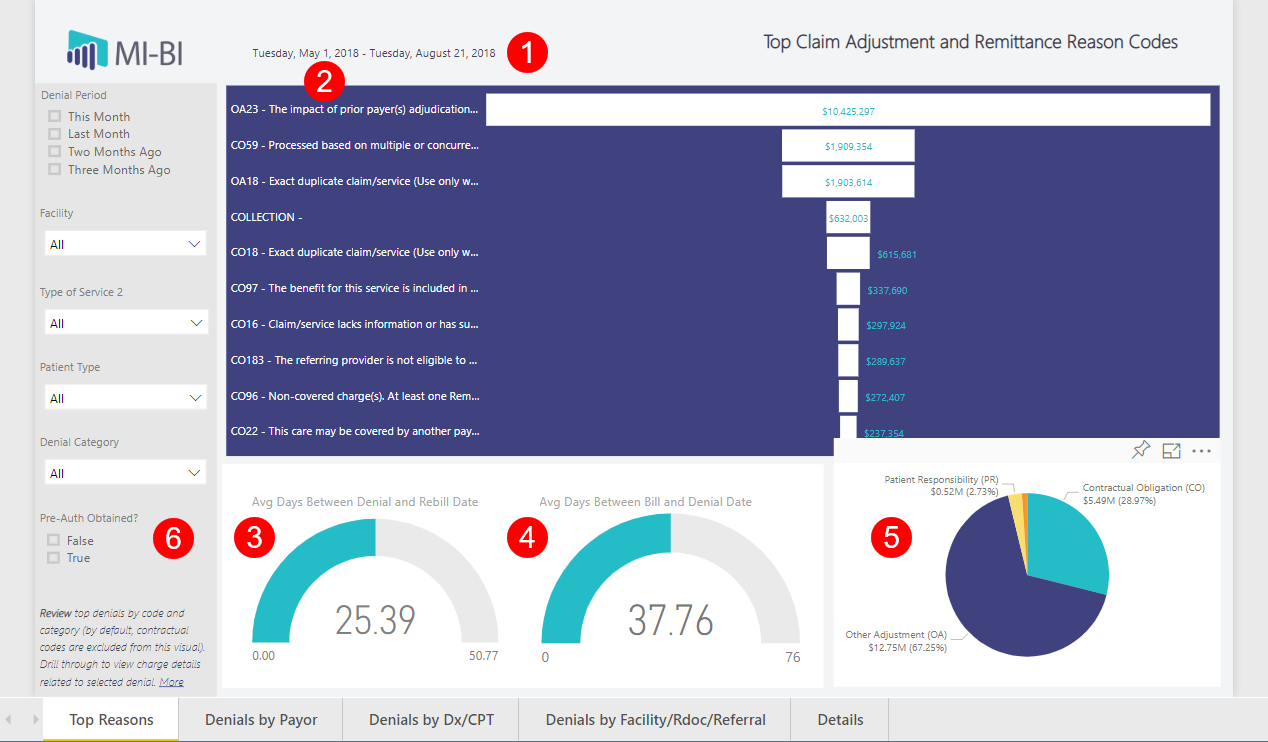
- Actual date range included in this report.
- Top denial codes (claim adjustment and remittance reason codes) that are not excluded by default are ranked by total dollar amount denied.
- Average Days between Denial and Rebill Dates is the average number days to process denials. Actual days are counted.
- Average Days between Bill and Denial Dates is the average number of days to receive denials.
- Proportion of denials by group, excluding the codes omitted by default. Click a denial group to update the rest of the page. Right-click and drill through to view charge details.
- Review denials where an authorization was obtained (True) and submitted on the claim, or (False) when no authorization number was submitted.
Denials by Payor
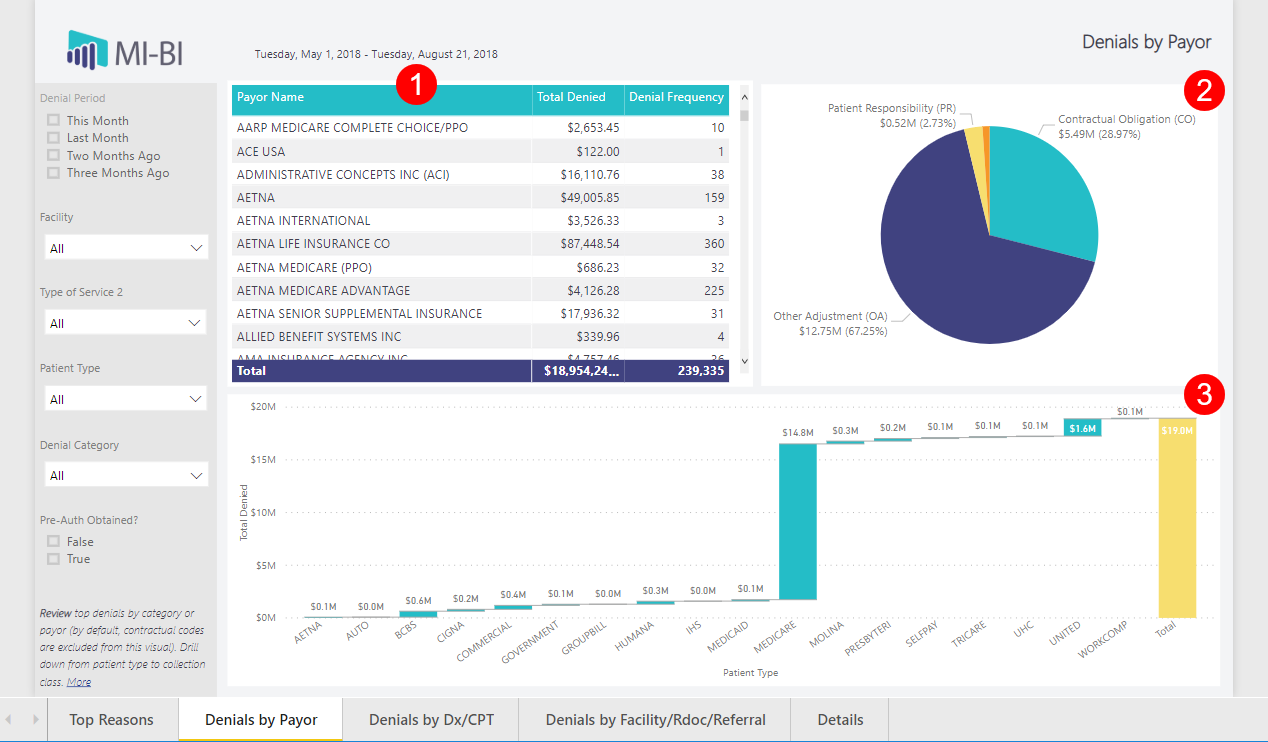
- Table of top denials by total amount denied and the rank or frequency of denials by Patient Type. Drill down to Network, Collection Class and Insurance Carrier.
- Proportion of denials by group, excluding the codes omitted by default. Click a denial group to update the rest of the page. Right-click and drill through to view charge details.
- Waterfall chart shows the total denied amount by Patient Type. Drill down to review by Collection Class.
Denials by Dx/CPT
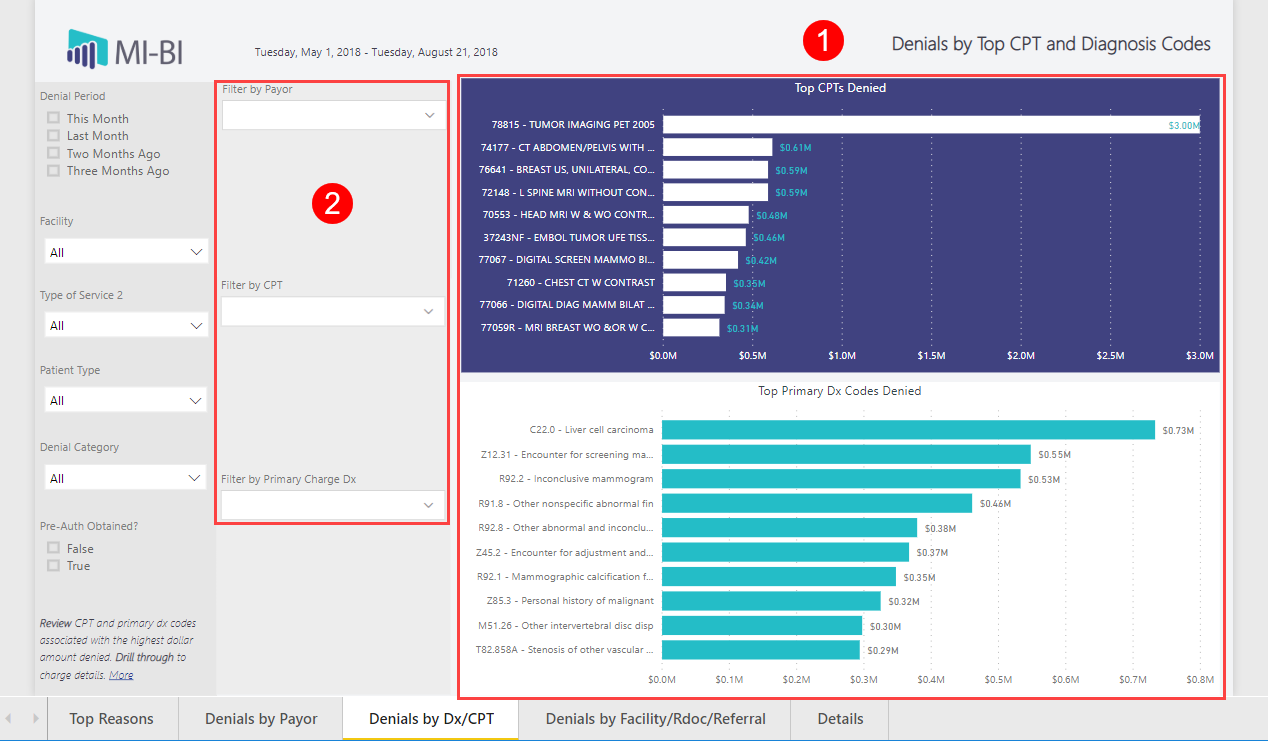
- Top CPT codes and Primary Diagnosis Codes denied by total dollar amount.
- Filter by one or more Payor Name, CPT code or Diagnosis Description by typing or selecting available options from drop-down list. Clear filters by clicking the eraser icon.
Denials by Facility/Rdoc/Referral
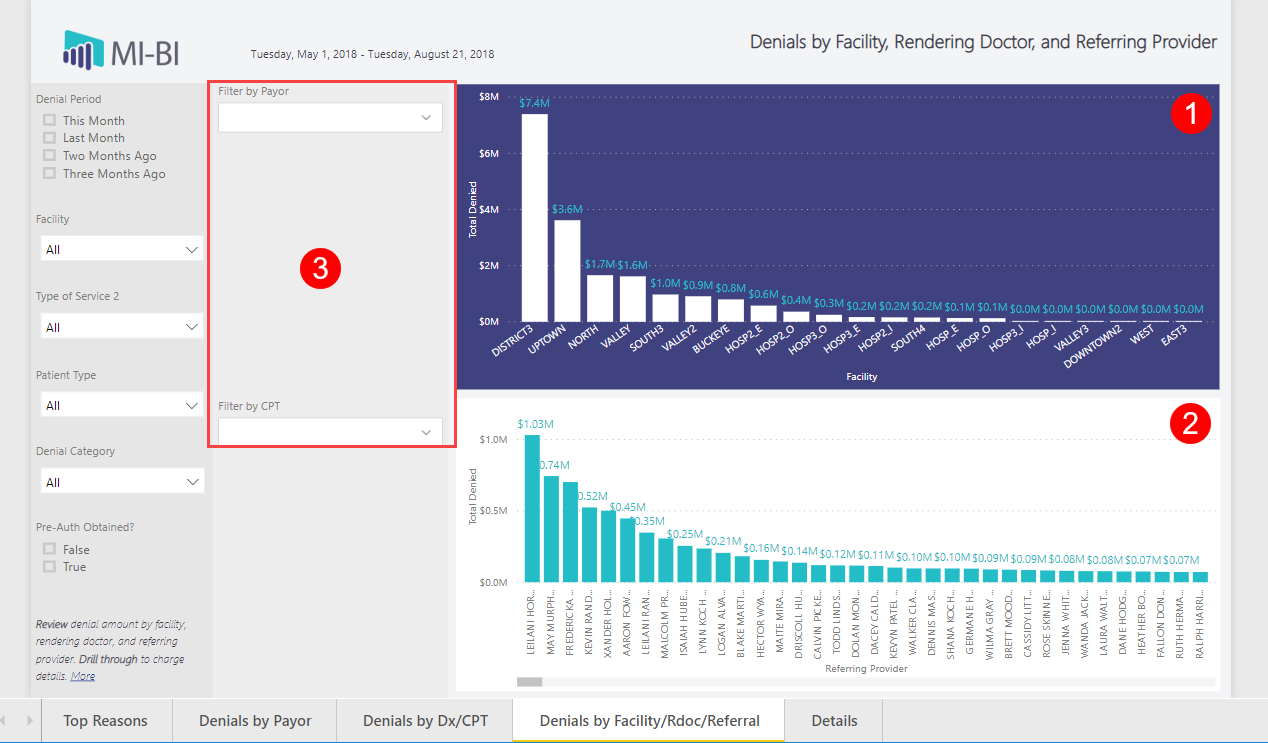
- Denial totals by performing facility.
- Denial totals by rendering provider.
- Filter by one or more Payor Name or CPT code by typing or selecting available options from drop-down list. Clear filters by clicking the eraser icon.
Details
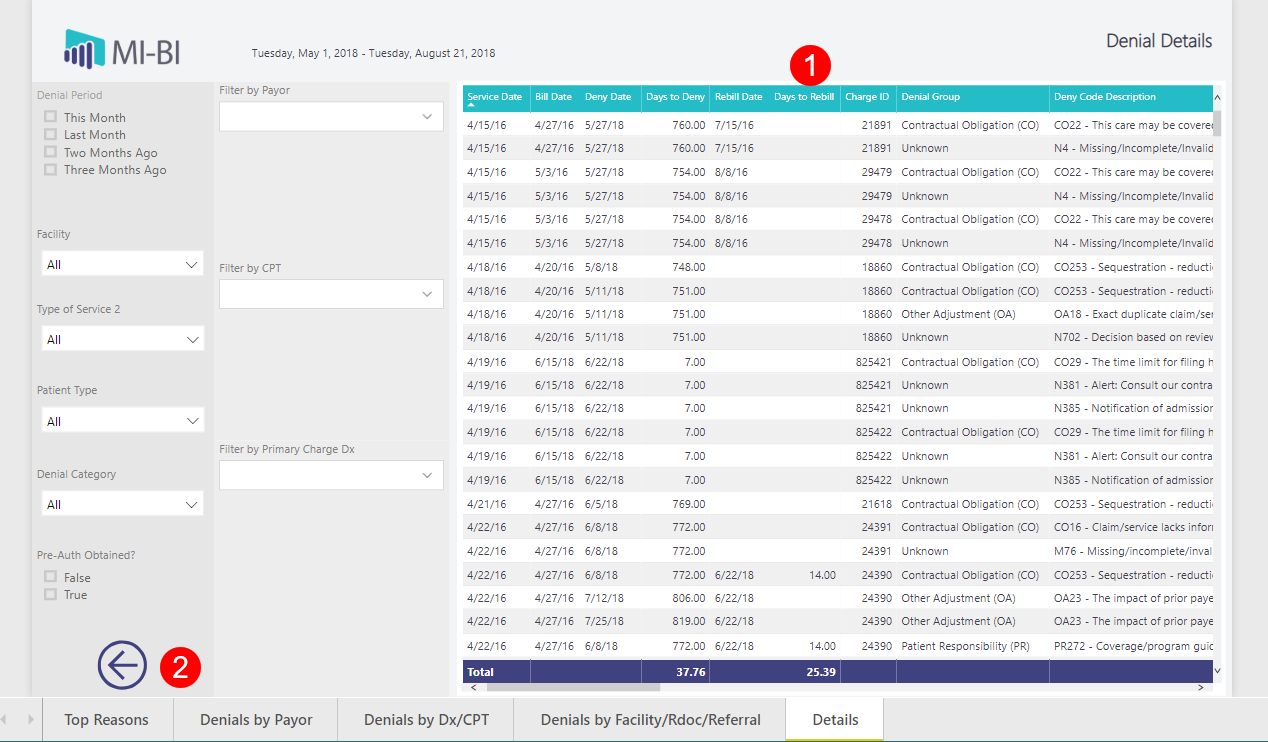
- Charge-level detail for the preceding reports. Most useful when the drill through feature is used to focus on a specific subset of data. Click on a column header to sort by any column.
- Use the arrow to return to the previous page.