 MI-BI Activity Log
Overview
Track security activity, including user counts, VIP patient access and administrative setup table activity. Bring life to the activity log by visualizing user patterns as they document and care for patients. Default date range is three calendar months.
Note: Both versions of this report are documented below, 1.770.1.1 and 1.774.0.0.
Requirements:
- MedInformatix version 7.7
- MedInformatix version 7.7.4 – new features included in v1.774.0.0
Data Source
[dbo].[pbi_activity_log]= view of [dbo].[CLACTIVITYLOG], [dbo].[CLMASTER], [dbo].[CLUSER], [dbo].[CLPROBLM],[dbo].[MWAPPTS] tables
Pages
Security Activity – User security and workgroup profile changes, VIP patient access, and total user logins to track against licensed user count.
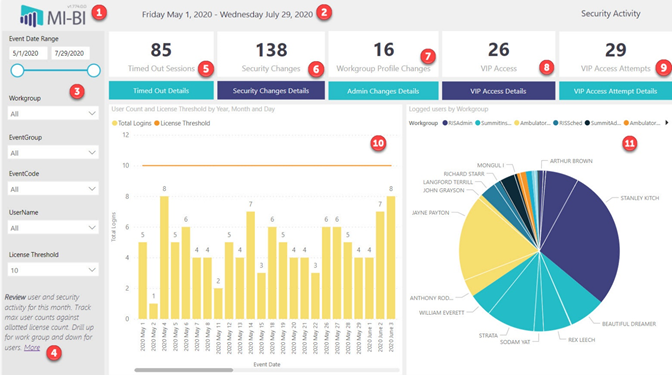
- MI-BI Logo (with version number) – click to reset slicers to default values.
- Current Date Range – Displays the actual date range presented in the current view.
- Slicers : (synced on every page unless otherwise noted)
- Event Date Range – Activity Log events include three calendar months from date of last refresh. By default, the report updates nightly. Use the date picker or slider to change the date range.
- Workgroup – Assigned workgroup for the user attributed to each logged event.
- Event Group – Category assigned to the event in the Activity Log.
- Event Code – Sub-category assigned to the event in the Activity Log.
- User Name – User attributed to the logged event.
- License Threshold – Hardcoded range from 10-500 with increments of 50. Default set at installation to correspond to the organization’s licensed user count. (only this page).
- Page Instructions – Included on each page of the report. Click the More link to open a new browser tab to the end-user report documentation in Resources.
- Timed Out Sessions (1.774.0.0 version only) – Number of sessions timed out for idle users. Based on global or workgroup setting. Idle user does not respond to the notification window alerting them that the session is expiring. Events are logged with the Event Group “SECURITY” and Event Code “Timed Out”.
- Timed Out Details – Click the bookmark bar to review event details, including the date/timestamp and user. Use the arrow in the bottom left corner to return to the previous page.
- Security Changes – Number of events recorded with the Event Group “Security” and Event Code not related to “VIP” within the selected date range. Events include changing a user’s workgroup profile, admin password changes and enabling/disabling VIP or Employee access.
- Security Changes Details - Click the bookmark bar to review event details, including the user, event description, date and stationid. Use the arrow in the bottom left corner to return to the previous page.
- Workgroup Profile Changes - Number of events recorded with the Event Group “Admin” and Event Code “WrkGrpProfileChg” within the selected date range. Events are logged when a workgroup profile is modified from the Security screen.
- Admin Changes Details - Click the bookmark bar to review event details, including the user, event description, date and stationid. Use the arrow in the bottom left corner to return to the previous page.
- VIP Access – Number of events recorded with the Event Group “Security” and Event Code “VIP Access” within the selected date range. Events are logged when users with VIP permissions access VIP patient charts.
- VIP Access Details - Click the bookmark bar to review event details, including the patient account, user, event description, date and stationid. Use the arrow in the bottom left corner to return to the previous page.
- VIP Access Attempts - Number of events recorded with the Event Group “SECURITY” and Event Code “VIP Access Attempt” within the selected date range. Events are logged when users with VIP permissions access VIP patient charts with #VIP enabled and are notified by a pop-up window that this patient has special permissions and gives them the option to continue into the patient’s chart or cancel.
- VIP Access Attempt Details - Click the bookmark bar to review event details, including the patient account, user, event description, date and stationid. Use the arrow in the bottom left corner to return to the previous page.
- User Count and License Threshold by Year, Month and Day (Stacked Chart) – Counts the total number of unique logins, where each user is counted once per day. The license threshold line corresponds to the value set by the License Threshold page slicer.
- Default timeline is daily user count. Drill up to Month and Annual counts. Expand (fork) back to a daily linear timeline.
- Tooltip – Hover for total logins and the average daily user count for the applicable month.
- Logged Users by Workgroup (Pie Chart) – Shows all users with activity logged in the selected date rangecategorized by workgroup.
- Tooltip – Hover for user code, username, and overall user logins within the date range.
- Cross-filter by clicking any user or workgroup to show dates that the user(s) logged in.
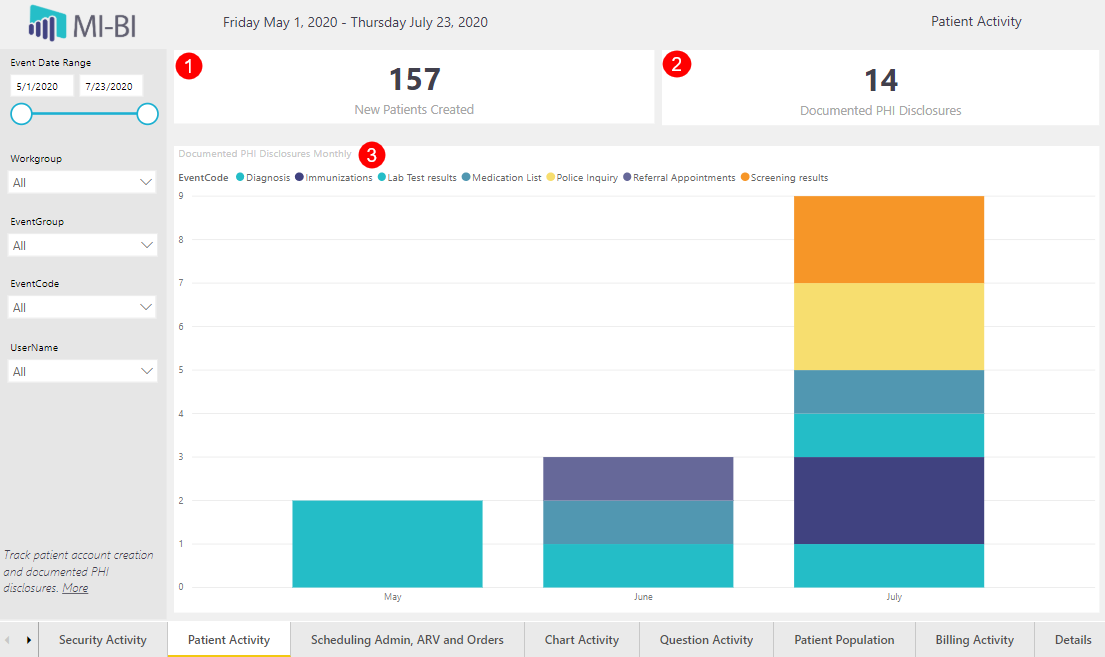
Patient Activity – Track the volume of new patients created and documented PHI disclosures.
-
- New Patients Created – Total number of new patients added to MedInformatix within the past 3 months. Events are logged with the Event Code “New Demographics”.
- Documented PHI Disclosures – Total number of disclosures documented in Accounting of Disclosures (Patient Demographics). Events are logged with the Event Group “AD”.
- Documented PHI Disclosures (Stacked Column Chart) – Categorizes disclosure events over time. Events are logged with the Event Group “AD” and Event Code for each type of disclosure (maintained in Preferences/Setup Other Tables). Drill up, down and expand (fork) to change the timeline.
Scheduling Admin, ARV and Orders – ARV activity, scheduling setup table changes and deleted orders.
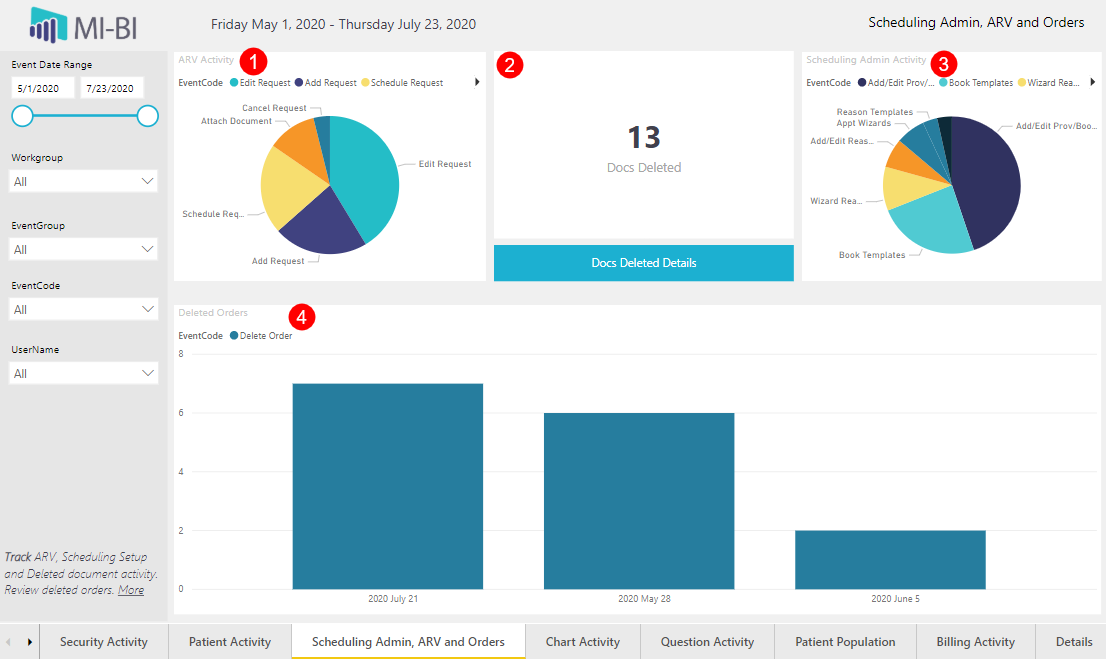
- ARV Activity (Pie Chart) – Events logged with the Event Group “APPTREQ” and categorized by Event Code, including “Add Request”, “Edit Request” and “Cancel Request”. Right-click and Drill through to Details to view specifics, such as patient account, date, user and stationid.
- Docs Deleted – Number of documents deleted (inactivated) from the Document Repository. Events recorded with the Event Group “CHART” and Event Code “Delete/Inactivate”.
- Docs Deleted Details - Click the bookmark bar to review event details, including the patient account, user, event description, date and stationid. Use the arrow in the bottom left corner to return to the previous page.
- Scheduling Admin Activity – Events logged with the Event Group “SCHED” and categorized by Event Code, including Add/Edit Provider Books, Add/Edit Reasons and Book Templates. Right-click and Drill through to Details to view specifics, such as patient account, date, user and stationid.
- Deleted Orders (Stacked Column Chart) – Number of orders deleted by users. Events recorded with the Event Group “ORDERSVIEW” and Event Code “Delete Order”. Drill up, down and expand (fork) to change the timeline.
Chart Activity – User activity related to opening and working in patient charts. Key performance indicators (KPIs) and trends over time related to clinical work managing patients.
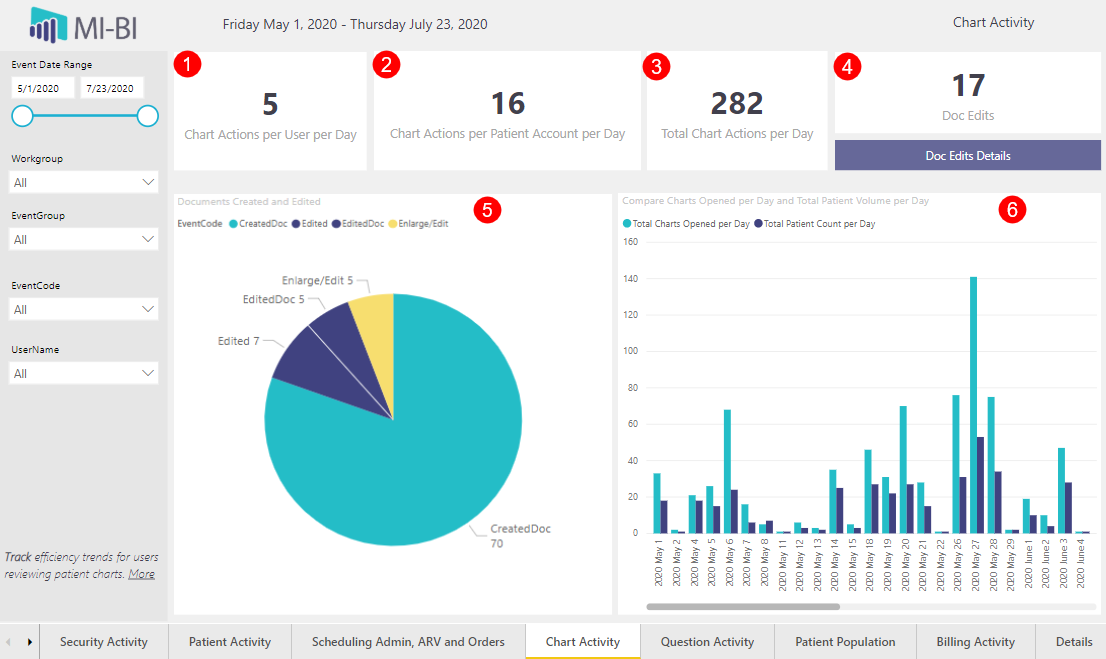
- Chart Actions per User per Day – What is the effort to work up patients per user? Chart actions logged per user, per day, within the selected date range. Actions could be in one or many patient accounts. Events are logged with the Event Group “CHART” and Event Code “Action”.
- Chart Actions per Patient per Day – What is the average effort to work up each patient? Chart actions logged per patient account from opening to closing the chart per day, within the selected date range. Events are logged with the Event Group “CHART” and Event Code “Action”.
- Total Chart Actions per Day – What is the average daily workload for patient care? Overall chart activity logged per day by different users on different accounts, within the selected date range. Events are logged with the Event Group “CHART” and Event Code “Action”.
- Doc Edits – Overall number of edits, including clicking Enlarge to edit a PDF, and editing, signing, or printing a document. Note: Signature attempts are recorded as “Edited” even if invalid signature and “Print” is recorded as “EditedDoc”. Events are logged with the Event Group “CHART” and the corresponding Event Code (see pie chart below).
- Doc Edits Details - Click the bookmark bar to review event details, including the patient account, user, event description, date and stationid. Use the arrow in the bottom left corner to return to the previous page.
- Documents Created and Edited (Pie Chart) – Events logged with the Event Group “CHART” and the corresponding Event Code, including “CreatedDoc”, “Edited”, “Enlarge/Edit”.
- Compare Charts Opened per Day and Total Patient Volume per Day – Total number of patient charts opened per day (distinct accounts) and total active patient volume per day. Drill up to compare monthly and yearly totals. Expand (fork) to return to the default linear, daily timeline.
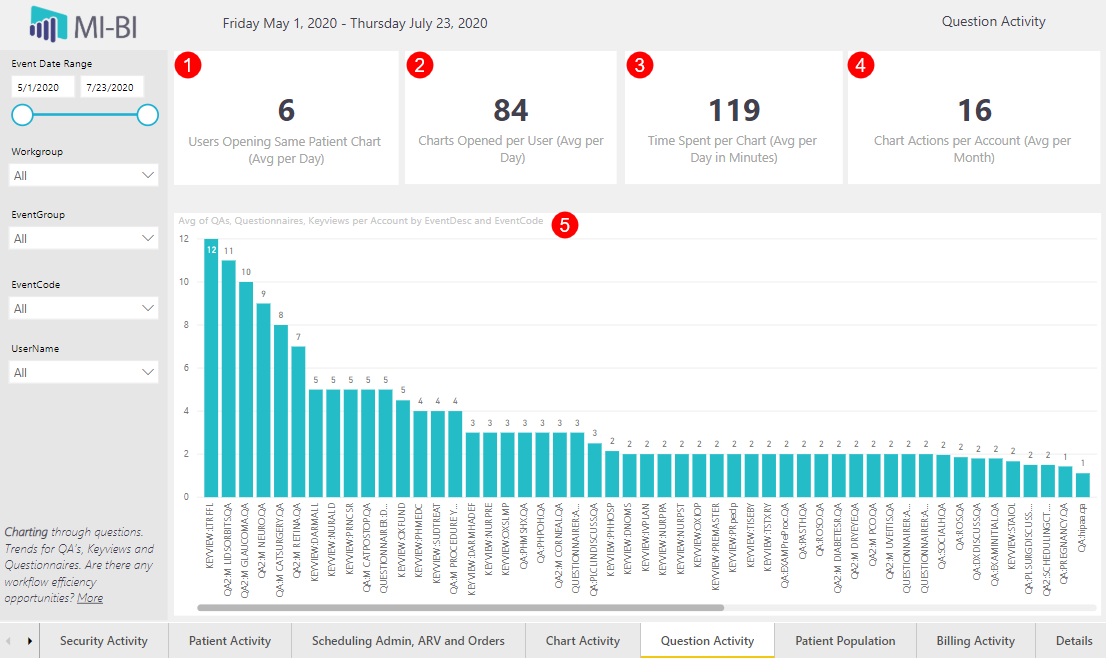
Question Activity - User activity related to opening and working in patient charts, time spent, and trends in questionnaire use (Keyviews and QAs).
-
- Users Opening Same Patient Chart (Avg per Day) – How many users does it take to work up patients? Average number of users that open the same patient chart per day. Events are logged with the Event Group “CHART” and Event Code “Open”.
- Charts Opened per User (Avg per Day) – How many patients do users work up? Average number of patient charts opened per user per day. Events are logged per user with the Event Group “CHART” and Event Code “Open”.
- Time Spent per Chart (Avg per Day in Minutes) – How long do users spend in a patient’s chart, on average? Time spent is calculated from the time a user opens the chart to the time they close the chart, in minutes. Events are logged per user with the Event Group “CHART” and Event Code “Open” and “Close”, respectively, for the same user and patient account.
- Chart Actions per Account (Avg per Month) – What is the monthly average effort to workup patients? Monthly average number of chart actions per patient account. Sum of all events logged with Event Group “CHART” and Event Code “Action” divided by the number of patient accounts divided by three months.
- QAs, Questionnaires, Keyviews per Account (Column Chart) – Which questionnaires are used the most? Keyviews, Questionnaires and QAs used within the date range and sorted by highest to lowest count. Events are logged with the Event Group “CHART”, Event Code “Action” and the Event Description captures the type and name.
- Tooltip – Hover to see the average chart actions per account (sum of occurrences for each event divided by distinct count of accounts linked to the same event)
- Right-click and Drill through to Details to view specifics, such as patient account, date, user and stationid.
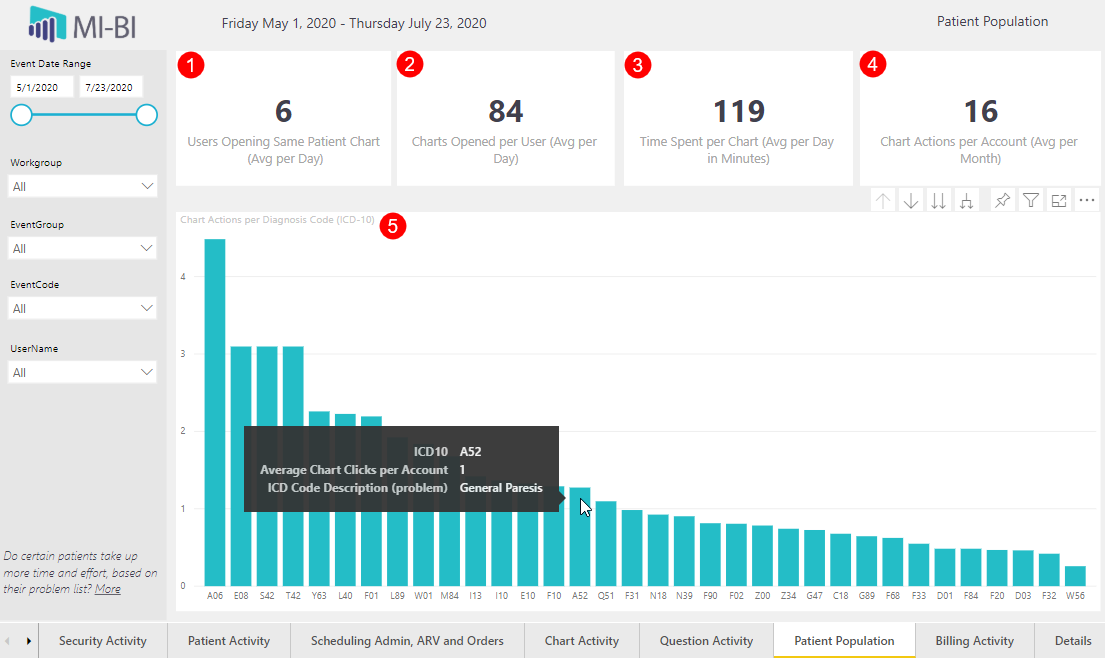
Patient Population - User activity related to opening and working in patient charts, time spent, and ranked list of patients by diagnosis code.
-
- Users Opening Same Patient Chart (Avg per Day) – How many users does it take to work up patients? Average number of users that open the same patient chart per day. Events are logged with the Event Group “CHART” and Event Code “Open”.
- Charts Opened per User (Avg per Day) – How many patients do users work up? Average number of patient charts opened per user per day. Events are logged per user with the Event Group “CHART” and Event Code “Open”.
- Time Spent per Chart (Avg per Day in Minutes) – How long do users spend in a patient’s chart, on average? Time spent is calculated from the time a user opens the chart to the time they close the chart, in minutes. Events are logged per user with the Event Group “CHART” and Event Code “Open” and “Close”, respectively, for the same user and patient account.
- Chart Actions per Account (Avg per Month) – What is the monthly average effort to workup patients? Monthly average of chart actions per patient account. Sum of all events logged with Event Group “CHART” and Event Code “Action” divided by the number of patient accounts divided by three months.
- Chart Actions per Diagnosis Code (Column Chart) – Is there more workup or effort for patients with certain conditions (based on problem list)? Or are the diagnosis codes listed (first three characters) the most common diagnosis codes for the patient population? Active diagnosis codes associated with patient accounts seen within the date range, are sorted by number of chart actions (average per account), from high to low, for the first three characters of the diagnosis code.
- Tooltip – Hover to view the code description, and average chart clicks per account (total chart actions per account with ICD code divided by number of counts with same ICD code)
Billing Activity – User activity related to billing edits and deleted charges.

- Billing Edits (Pie Chart) – Overall billing edits by activity. Events are logged with the Event Group “BILLING” and corresponding Event Code, including “Edit Episode”, “Edit Charge” and “Post Charge”. Note that deleted charges are logged as “Security Window Accessed”. Right-click and Drill through to Details Details to view specifics, such as patient account, date, user, stationed, and event description, which logs the charge Id.
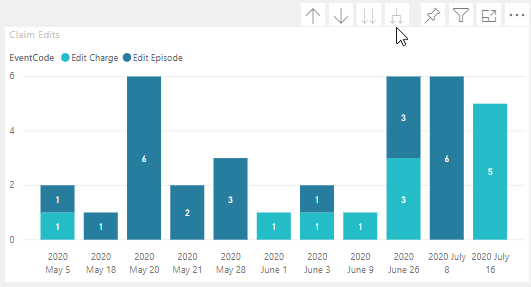
- Claim Edits – Number of claim and episode edits logged within the date range. Events are logged with the Event Group “BILLING” and the Event Code “Edit Charge” or “Edit Episode”.
- Deleted Charges – Number of deleted charged logged within the date range. Events are logged with the Event Group “BILLING” and the Event Code “Security Window Accessed”.
- Deleted Charge Details - Click the bookmark bar to review event details, including the patient account, user, event description (charge Id), date and stationid. Use the arrow in the bottom left corner to return to the previous page.
- Deleted Charges (Column Chart) – View deleted charges by event date. Drill up/down for annual, monthly and expand (fork) to view by linear, date timeline. Right-click and Drill through to Details to view specifics, such as patient account, date, user, stationed, and event description (charge Id).
- Claim Edits (Stacked Column Chart) – View claim edits by event date, color-coded for charge and episode edits. Drill up/down for annual, monthly and expand (fork) to view by linear, date timeline. Right-click and Drill through to Details to view specifics, such as patient account, date, user, stationed, and event description (charge Id).
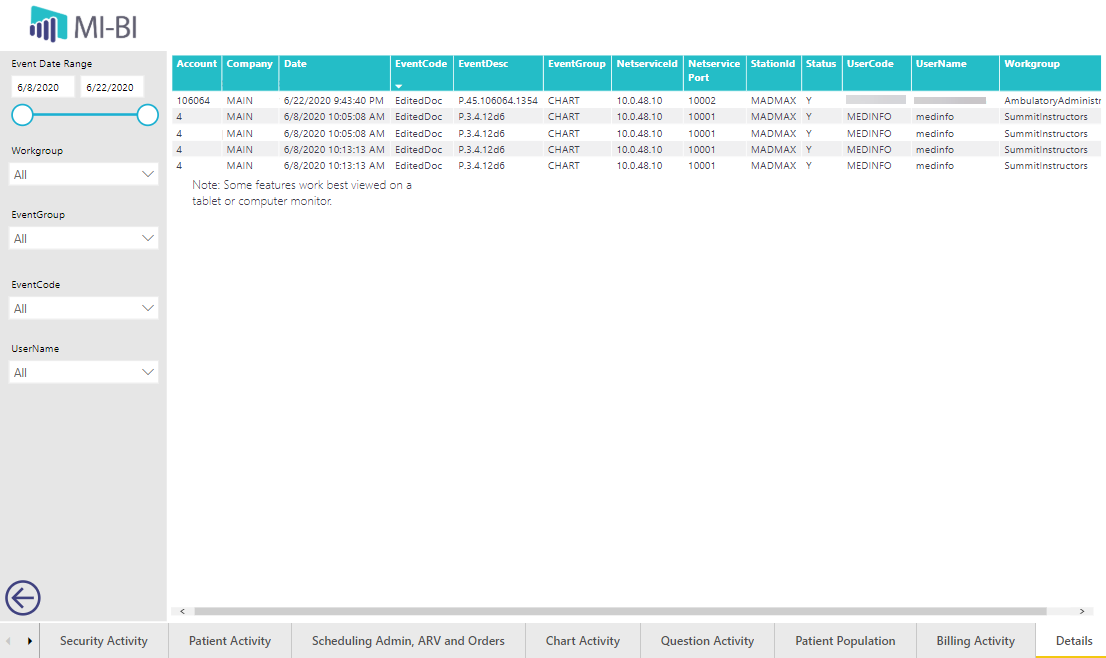
Details – View the Activity Log details by clicking a dedicated “Details” bookmark or right-clicking on a specific visual to Drill-through to the Details page. Click the arrow in the bottom right corner to return to the previous page.
-
Company – MedInformatix Company (blank if user logs in without a default company)
-
Account – Patient account number (when applicable to the action logged)
-
Date –Date when the event was logged
-
Workgroup – Workgroup of the logged-in user
-
Usercode – User code of the logged-in user
-
UserName – Username assigned to the logged-in user
-
EventCode – Sub-category assigned to the event
-
EventDesc – Additional detail, when present, to describe the event
-
EventGroup – Category assigned to the event
-
Volume – For performance reasons, only the event date is included in the report, not the event timestamp. If the same event is logged multiple times for the same user on the same date, then the volume will be greater than 1.